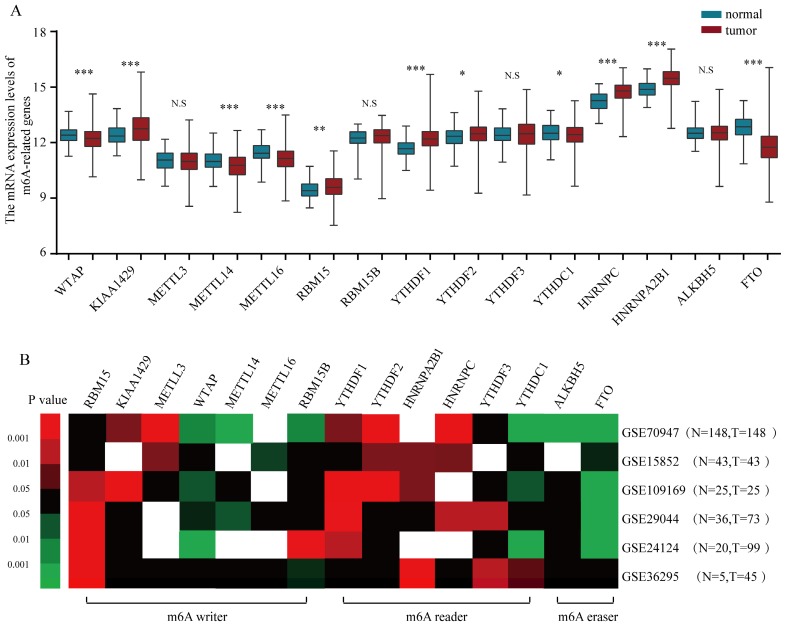
Figure 1.
The altered expression profiles of m6A related genes in human BRC tissues. (A) The mRNA expression profiles of m6A-related genes in TCGA-BRCA cohort. (B) Heatmap showing the mRNA expression alteration of m6A related genomic targets in six independent GEO microarray datasets. Red means up-regulated; green means down-regulated; black means not significant; blank means genes are not expressed or absent in the datasets. Statistical analysis was performed in Student's t test (unpaired, two-tailed)

