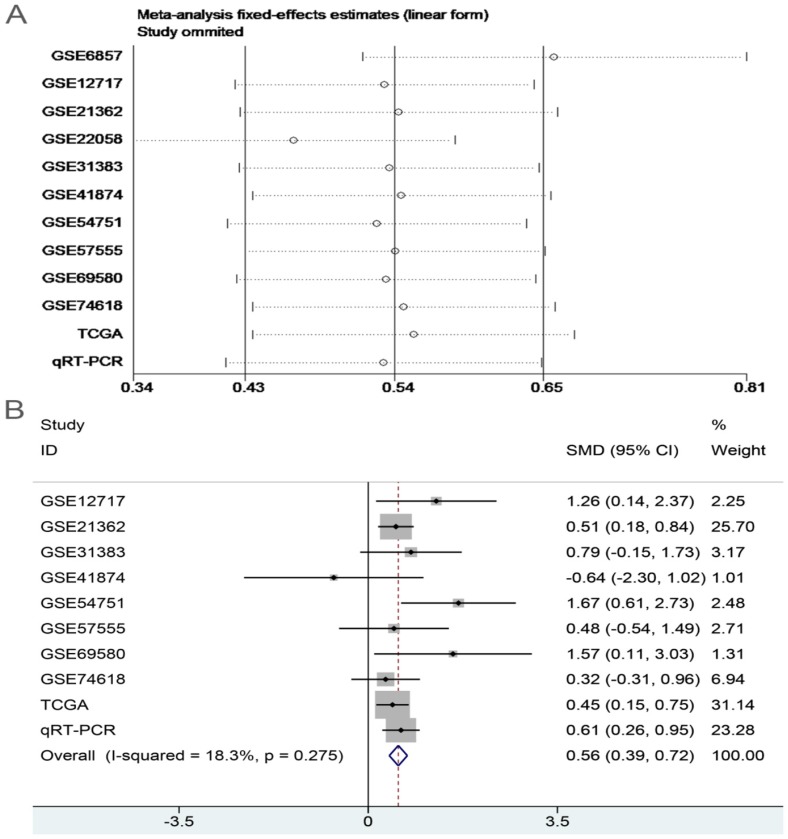
Figure 7.
Sensitivity analysis and the forest plot after sensitivity analysis. A: sensitivity analysis of Meta-analysis of the expression level of miR-196b-5p in HCC group and in non-tumor group based on TCGA, GEO and qRT-PCR. B: forest plot of miR-196b-5p expression between HCC group and non-tumor group after removing the study of GSE6857 and GSE22058.

