Figure 5.

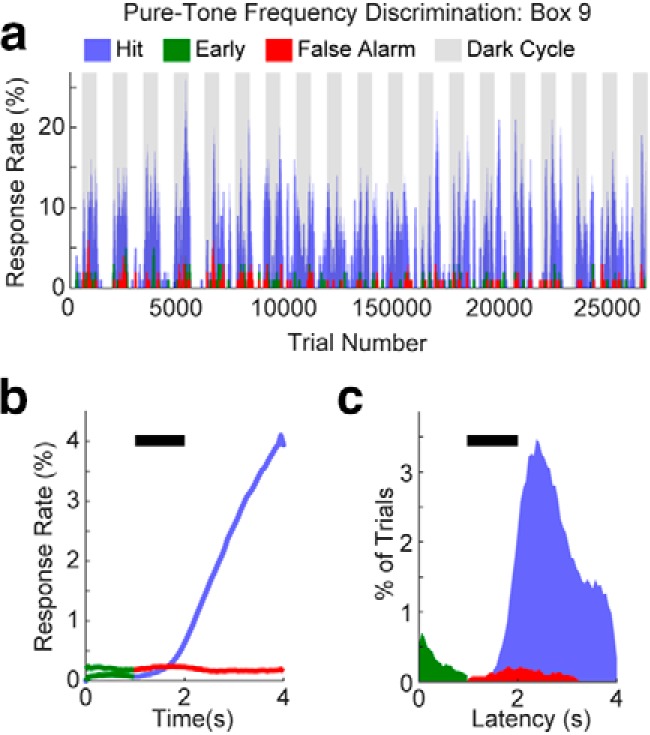
Pure-tone frequency discrimination task performance. a, Example of behavioral data collected over 19 consecutive days in a single ToneBox of two mice. b, Hit, early, and false alarm response rate histograms across time in a trial, color coded as in a. c, Hit, early, and false alarm latency histograms across time in a trial, color coded as in a.
