
Figure 6.
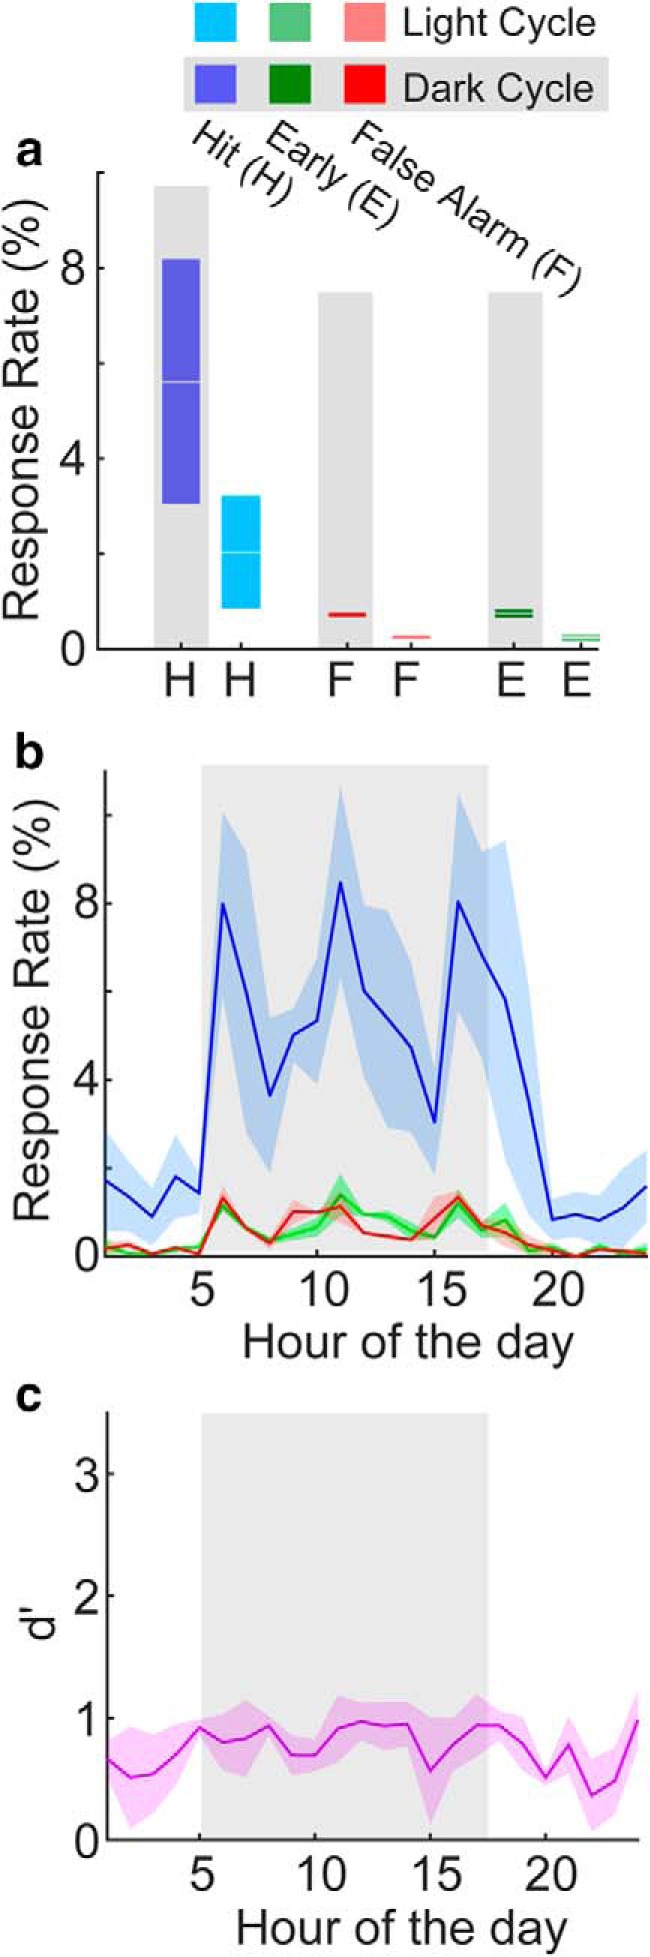
Statistical distributions of tone discrimination response rates across two ToneBoxes. a, Response rate-based task performance accuracy box plots for hits during the dark cycle (dark blue) and light cycle (light blue), false alarms during the dark cycle (dark red) and light cycle (light red), and for early responses also during the dark cycle (dark green) and light cycle (light green). b, Hit, false alarm, and early rates shown for each hour of the day. The dark cycle is shown in the shaded region. Data color coded as in a. Shading shows 2 SEMs. c, Response rate-based d´ values for each hour of the day. Shading shows ±2 SEMs.