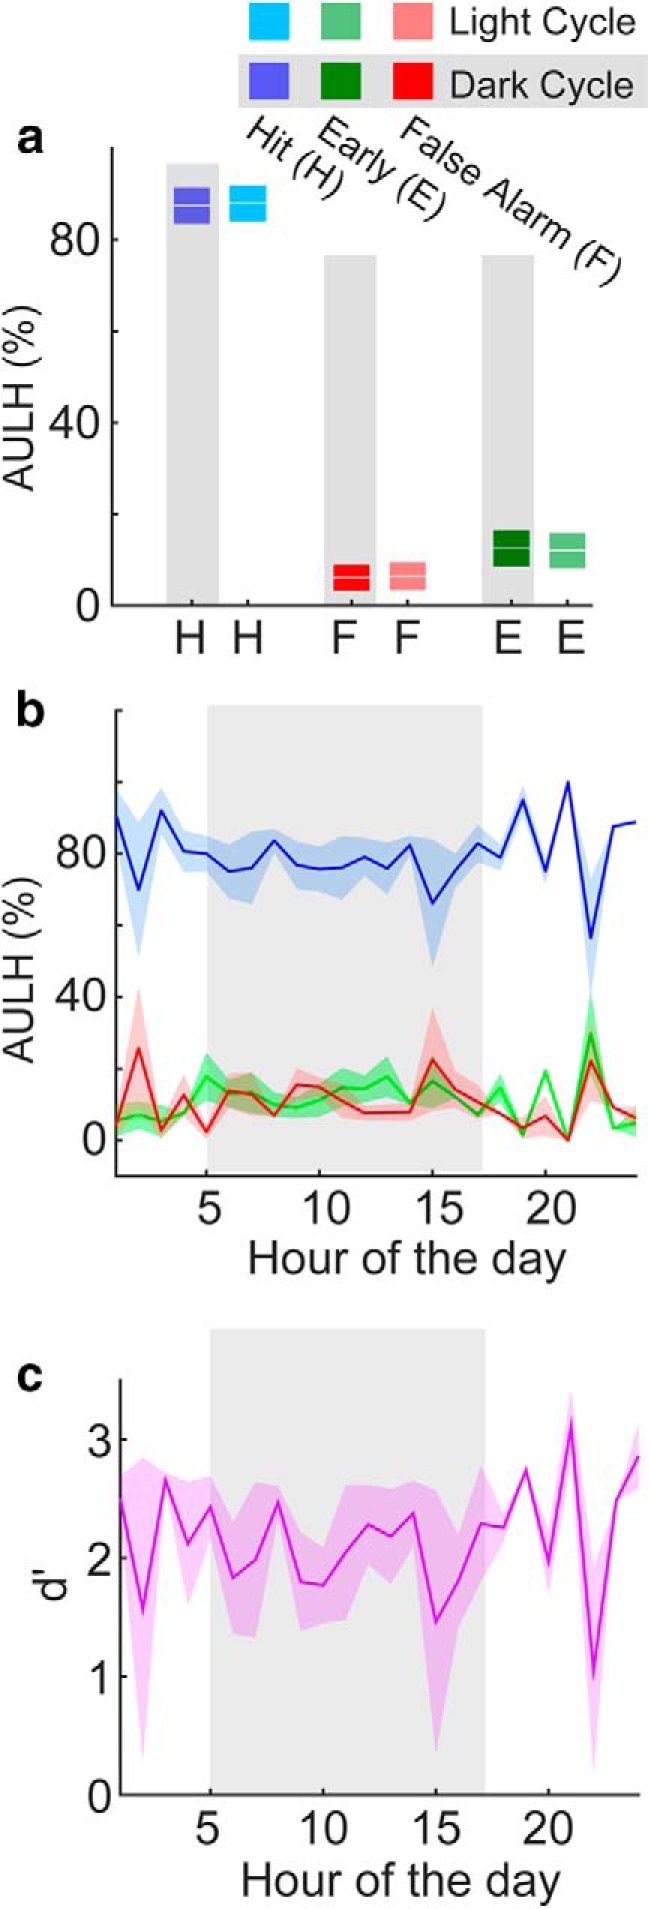
Figure 7.

Statistical distributions of tone discrimination response latencies across two ToneBoxes. a, Latency-based task performance accuracy box plots. Performance accuracy was defined here by the AULH for hit and early responses. b, Response latency-based task performance accuracy shown for each hour of the day, and for hit, false alarm, and early responses. The dark cycle is shown in the shaded region. Shading shows ±2 SEMs. Data color coded as in a. c, Response latency-based d´ values for each hour of the day. Shading shows ±2 SEMs.
