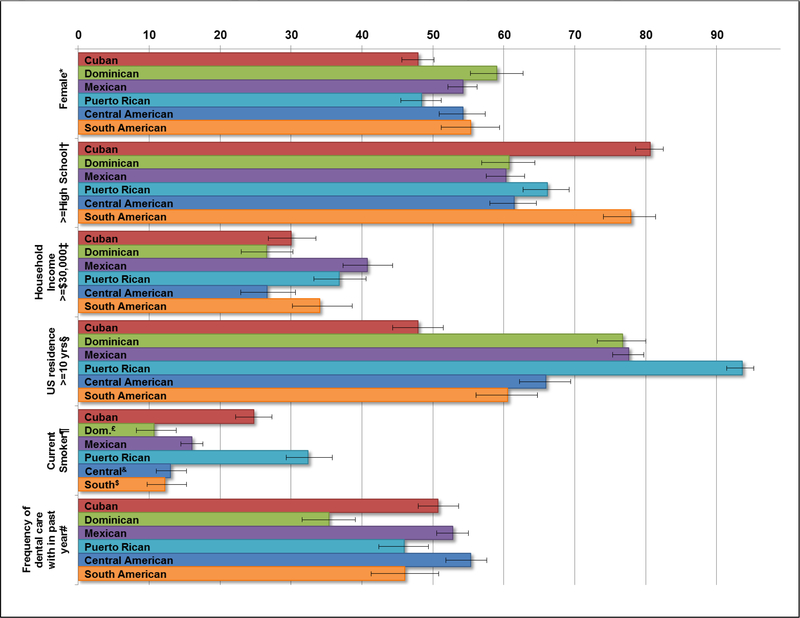
Figure 1. Prevalence of demographic characteristics by Hispanic/Latino Background: HCHS/SOL 2008–2011.
All values are weighted for study design and nonresponse and are age standardized to Census 2010 US population, p-value<0.05 from Wald test for Latino subgroup differences for all characteristics. *reference=Male; †reference=<High School education; ‡reference=Household income <$30,000; §reference=US residence <10 years, ¶reference=Non-smokers; #reference=frequency of dental care>1y; £=Dominican; &=Central American; $=South American

