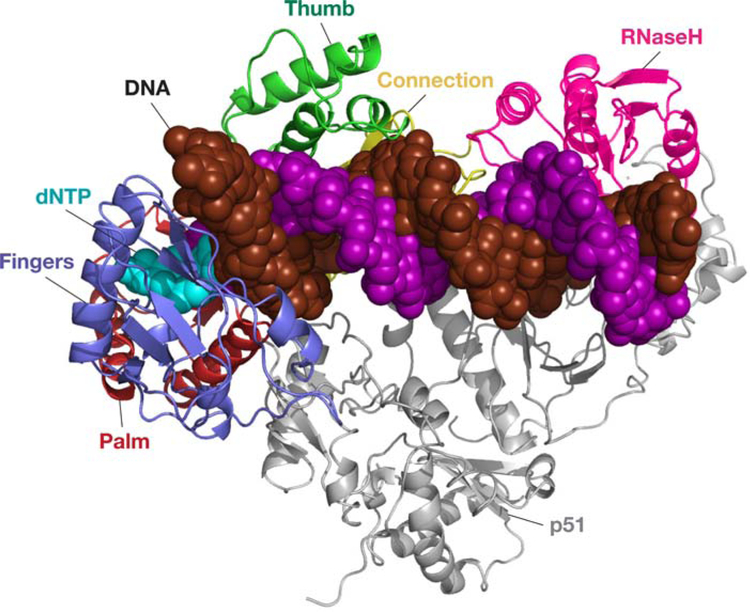
FIGURE 2.
HIV-1 RT in a complex with dsDNA and an incoming dNTP. RT is shown as a ribbon diagram; the DNA and the incoming dNTP are shown as space filling models. The p51 subunit (at the bottom) is shown in gray. The RNase H domain is shown in pink, and the four subdomains to the polymerase domain are shown in different colors: fingers, blue; thumb, green; palm, red; and connection, yellow. The DNA template strand (the strand that is being copied) is dark red and the primer strand (the strand that is being extended) is purple. The incoming dNTP is light blue. doi:10.1128/microbiolspec.MDNA3–0027-2014.f2

