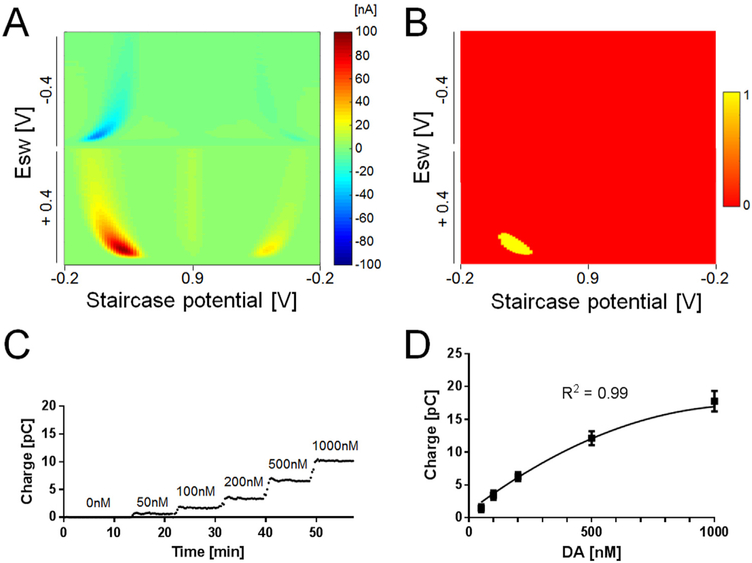
Fig. 4.
Dopamine response to M-CSWV and analysis for calibration. (A) Pseudo color plot of 1 μM dopamine response to M-CSWV. (B) Dopamine kernel extracted from (A). Thresholding the pseudo color plot by 60% of the maximum amplitude set the top 40 percentiles (red, dopamine-featured area) to one and remaining (green) to zero. (C) Steady-state current response obtained for the oxidation of dopamine at forward sweep upon the injection of multiple concentrations. (D) A calibration plot obtained by M-CSWV correlates with dopamine concentrations (n = 4 electrodes, R2 = 0.99, quadratic regression).

