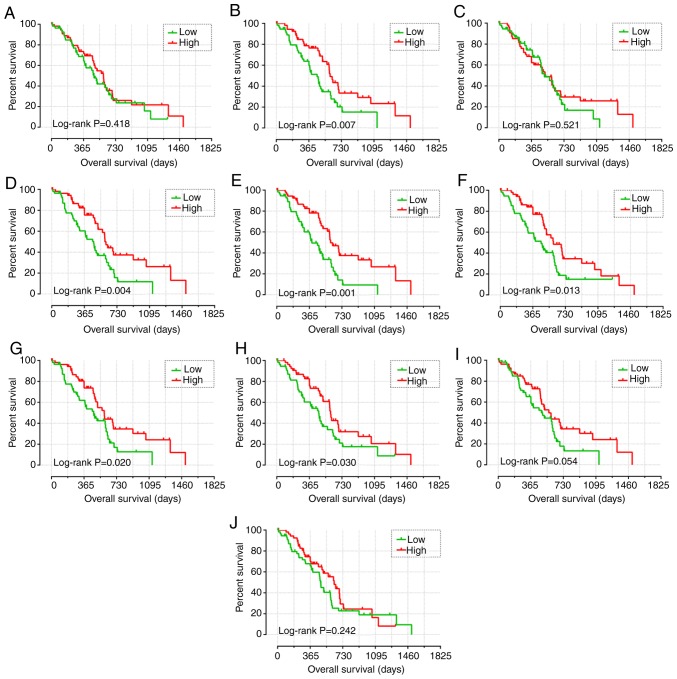
Figure 3.
Kaplan-Meier survival curve analysis of the association between the high and low expression levels of CCR genes and overall survival in patients with early-stage PDAC, generated using The Cancer Genome Atlas. Overall survival curves for (A) CCR1, (B) CCR2, (C) CCR3, (D) CCR4, (E) CCR5, (F) CCR6, (G) CCR7, (H) CCR8, (I) CCR9 and (J) CCR10. CCR, C-C motif chemokine receptor; PDAC, pancreatic ductal adenocarcinoma.

