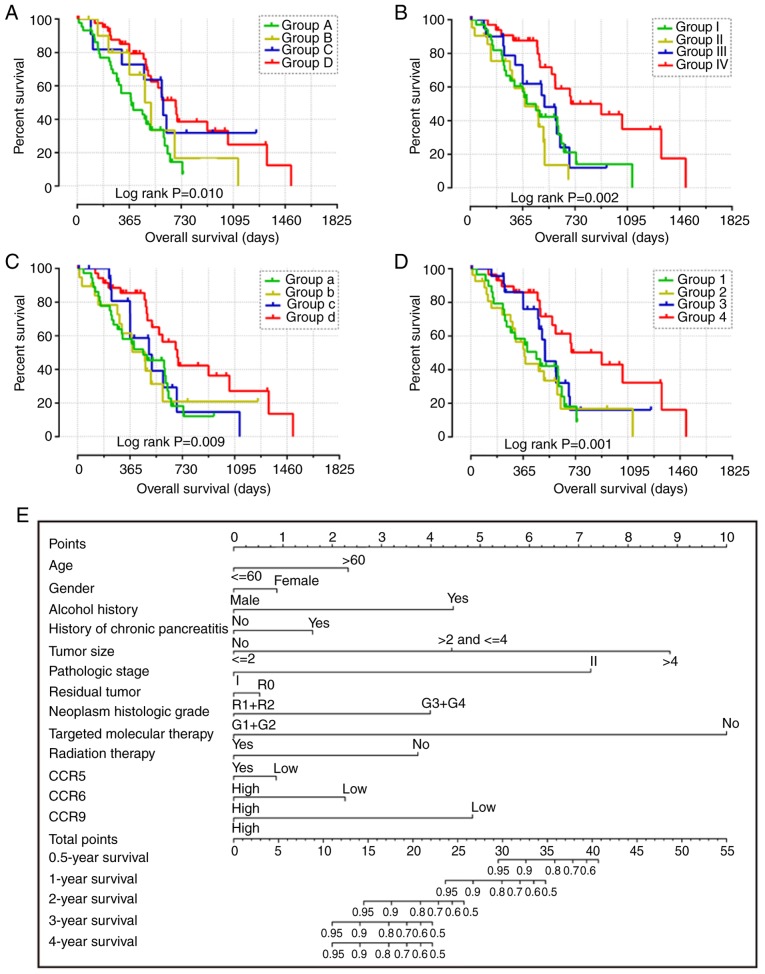
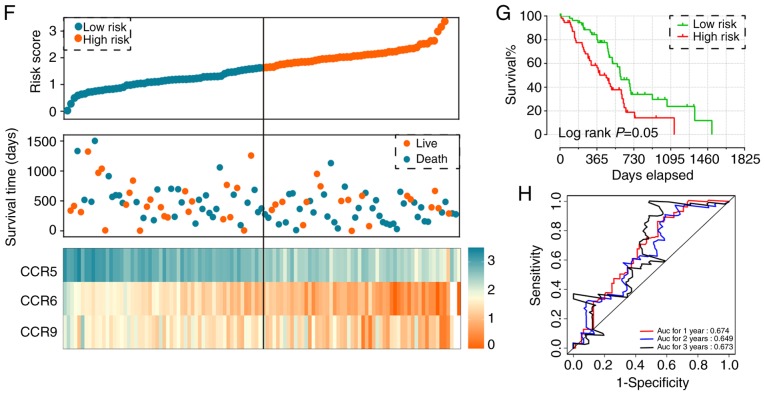
Figure 4.
Combined effect of CCR5, CCR6 and CCR9 on the overall survival of patients with early-stage PDAC. Nomogram for predicting 1-, 2- and 3-year events and a prognostic model with risk score, in terms of CCR5, CCR6 and CCR9 expression in early-stage PDAC. (A) Overall survival curves for the combined effect of CCR5 and CCR6. Group A, Low CCR5 + Low CCR6; Group B, Low CCR5 + High CCR6; Group C, High CCR5 + Low CCR6; Group D, High CCR5 + High CCR6. (B) Overall survival curves for the combined effect of CCR5 and CCR9. Group I, Low CCR5 + Low CCR9; Group II, Low CCR5 + High CCR9; Group III, High CCR5 + Low CCR9; Group IV, High CCR5 + High CCR9. (C) Overall survival curves for the combined effect of CCR6 and CCR9. Group a, Low CCR5 + Low CCR9; Group b, Low CCR5 + High CCR9; Group c, High CCR5 + Low CCR9; Group d, High CCR5 + High CCR9. (D) Overall survival curves for the combined effect of CCR5, CCR6 and CCR9. Group 1, Low CCR5 + Low CCR6 + Low CCR9; Group 2, Low CCR5 + Low CCR6 + High CCR9, High CCR5 + Low CCR6 + Low CCR9, and Low CCR5 + High CCR6 + Low CCR9; Group 3, Low CCR5 + High CCR6 + High CCR9, High CCR5 + High CCR6 + Low CCR9, and High CCR5 + Low CCR6 + High CCR9; Group 4, High CCR5 + High CCR6 + High CCR9. (E) Nomogram for predicting 1-, 2- and 3-year events (mortalities) that combine clinical data with CCR5, CCR6 and CCR7 expression. (F) From top to bottom; risk score plot, survival status scatter plot and heat map of the expression levels of CCR5, CCR6 and CCR9 in low- and high-risk groups. (G) Kaplan-Meier curves for low- and high-risk groups. (H) Receiver operating characteristic curve for predicting 1-, 2- and 3-year survival in patients with early-stage PDAC by risk score. CCR, C-C motif chemokine receptor; PDAC, pancreatic ductal adenocarcinoma.


