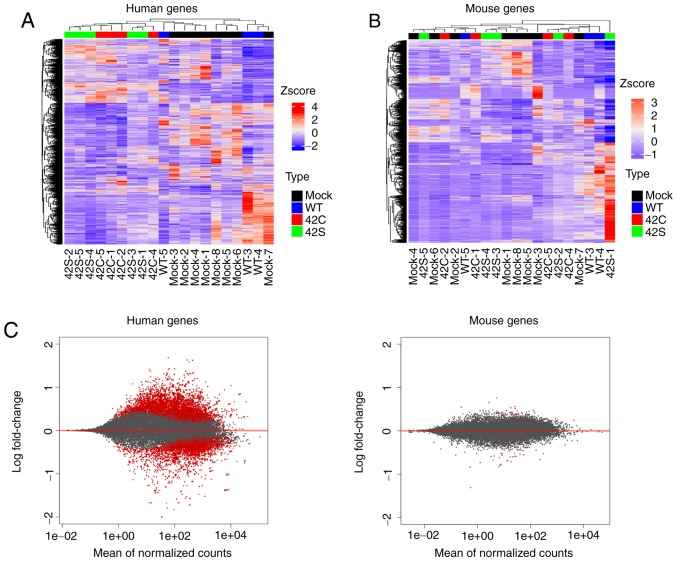
Figure 2.
Transcriptome analysis of orthotopic inoculated tumors. Hierarchical clustering of the differentially expressed human genes (A) and mouse genes (B) across all samples is shown vertically for genes and horizontally for the tumor samples. Samples that are mock, wild-type (WT), Y42C, and Y42S are indicated in black, blue, red, and green, respectively. In the matrix table, red indicates high expression and blue indicates low expression profiles. (C) MA plots of altered gene expression between the Y42C/Y42S group and mock/WT group in human genes (tumor, left panel) and mouse genes (stroma, right panel). Each dot represents a transcript. The x-axis shows normalized counts and the y-axis shows the expressional change in log scale. Transcripts with an adjusted P-value <0.1 are shown in red.

