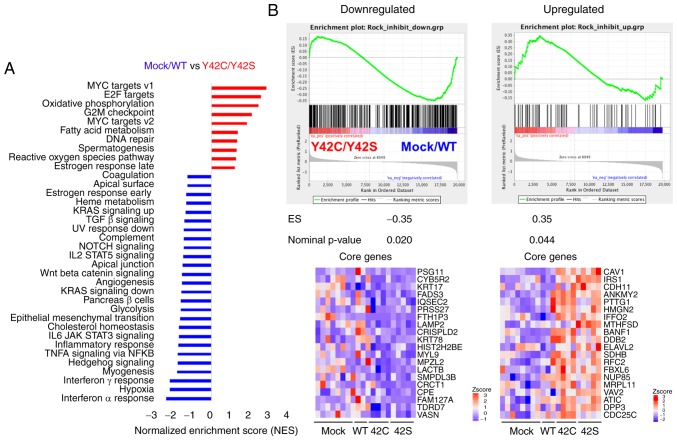
Figure 3.
GSEA analysis of mock/WT vs. Y42C/Y42S. (A) GSEA analysis using hallmark gene sets from the Molecular Signature Database (see: http://software.broadinstitute.org/gsea/msigdb/index.jsp) was carried out. The statistically significant signatures were selected (FDR <0.25) and placed in order of normalized enrichment score (NES), which represents the strength of the relationship between the phenotype and gene signature. Red bars indicate the pathways enriched in the Y42C/Y42S group and blue bars indicate those enriched in the mock/WT group. (B) GSEA results of the correlation between gene sets in the two groups and the gene signatures reported after treatment with a ROCK inhibitor. The GSEA results for downregulated genes are in the left panel, and for upregulated genes in the right panel. In each enrichment plot, the green curve corresponds to the enrichment score (ES) curve, which is the running sum of the weighted ES. The nominal P-value estimates the statistical significance of a single gene set's enrichment score. Heat maps show the top 20 core genes (ranked by ‘Rank Metric Score’, which is the signal to noise ratio for each gene used to position the gene in the ranked list) that drive the enrichment score of the GSEA clusters. Heat maps of the total core genes are shown in Fig. S3. GSEA, Gene Set Enrichment Analysis; ROCK, Rho-associated kinase.

