Figure 4.
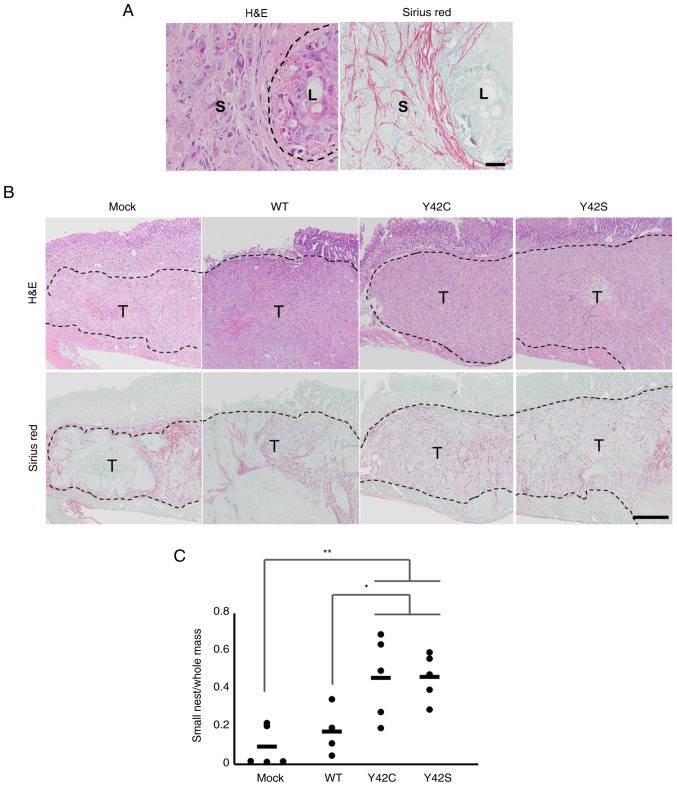
Histopathological evaluation of the formation of small tumor nests. (A) Representative images of small (S) and large (L) tumor nest areas. H&E, hematoxylin and eosin stain (left), and Sirius red stain (right). Scale bar, 100 µm. (B) Representative images of the tissue sections in mock, WT and RHOA mutants. The tumor nests are circumscribed by collagen fibers. T, tumor area. Scale bar, 1 mm. H&E, hematoxylin and eosin stain (upper row), and Sirius red stain (bottom row). (C) The ratio of small tumor nest area to total tumor area. Each dot represents the ratio in a tumor tissue section from 1 animal. The bars show the average for each group. *P<0.05, **P<0.01, one-way analysis of variance followed by a Dunnett's test. WT, wild-type; RHOA, Ras homolog family member A.

