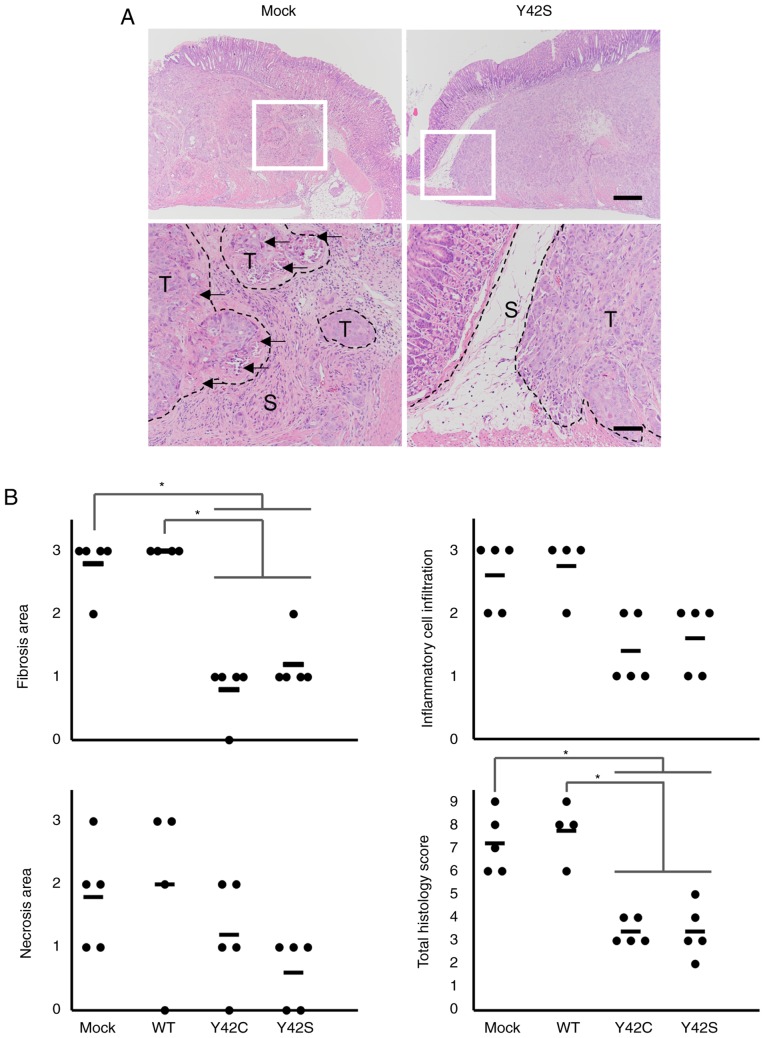
Figure 6.
Histological evaluation of the invasive front of tumors using hematoxylin and eosin stain. (A) Representative images of the invasive front of the tumor mass. The areas marked in squares in the upper row are shown at higher magnification in the lower row. The inflammatory cell infiltration with fibrosis observed in the stroma of the mock tumor is markedly weaker in the mutant tumor. S, stroma; T, tumor mass. Arrows show necrosis of tumor cells. Scale bar, 500 µm (upper panels) and 200 µm (lower panels). (B) Scoring for host reaction in the invasive front. Scoring criteria: 0, not observed; 1, occasionally observed; 2, moderately observed; 3, frequently observed. The total histology score is the sum of scores for the other three findings. Each dot stands for the score in a tumor tissue section from 1 animal. The bars show the average for each group. *P<0.05, difference between mutant group and control group was assessed with Steel's test. WT, wild-type.

