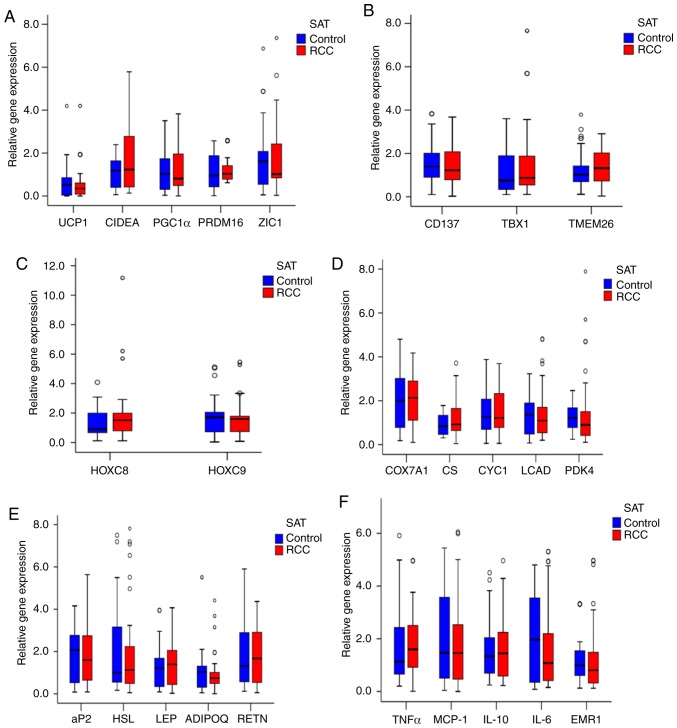
Figure 2.
Expression of UCP1 and other genes in the bSAT of the RCC and control groups. (A) RT-qPCR analysis of UCP1 and other BAT genes in bSAT (n=104). (B) RT-qPCR analysis of brown adipocyte genes in the RCC and control groups (n=104). (C) RT-qPCR analysis of white adipocyte genes in the RCC and control groups (n=104). (D-F) RT-qPCR analysis of the mRNA levels of metabolism-related genes and mitochondrial genes in the RCC and control groups (n=104). RCC, renal cell carcinoma; RT-qPCR, reverse transcription-quantitative polymerase chain reaction; UCP1, uncoupling protein 1; BAT, brown adipose tissue; bSAT, back subcutaneous adipose tissue.

