Figure 3.
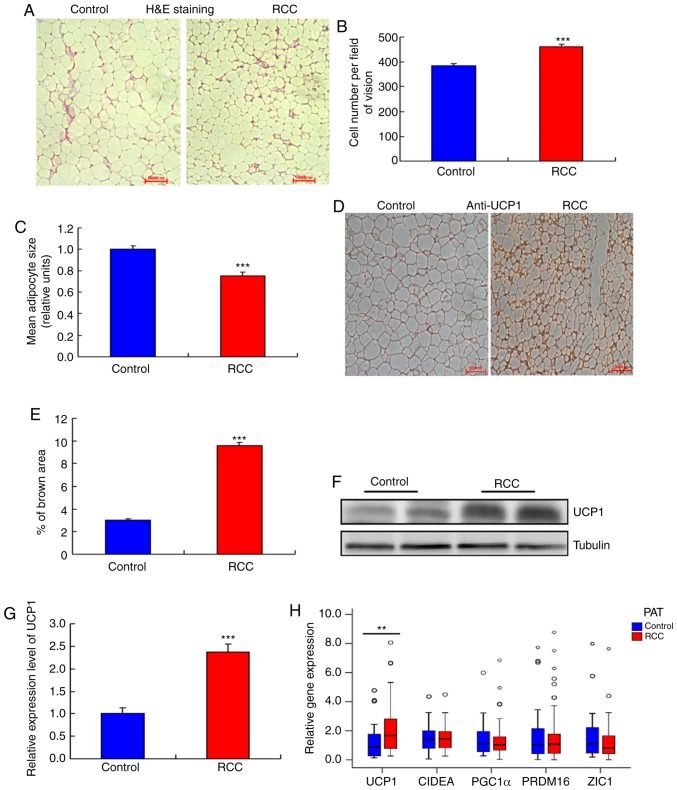
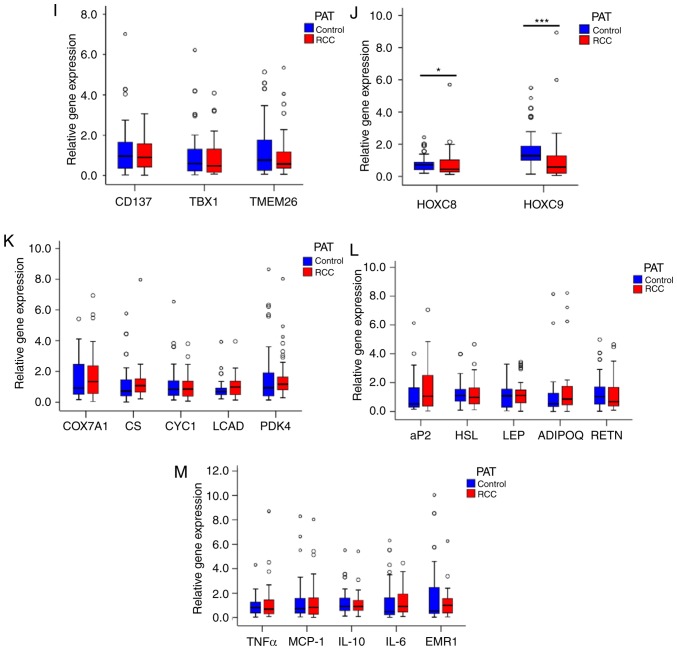
Higher UCP1 expression in the PAT of the RCC group. (A) Morphology of the PAT. Representative hematoxylin and eosin (H&E) staining images are shown (n=20). (B) Size of adipocytes in the RCC and control groups (magnification, ×200). Data are presented as the mean ± standard deviation (SD), n=20 (***P<0.001). (C) Number of adipocytes in the RCC and control groups (magnification, ×200). Data are presented as the mean ± SD, n=20. (***P<0.001). (D) UCP1 staining in the PAT of the RCC and control groups. Representative images are shown (n=20). (E) Quantification of UCP1 staining in the RCC and control groups. Data are presented as the mean ± SD, n=10 (***P<0.001). (F and G) Western blot analysis of the UCP1 level in the PAT of the RCC and control groups (n=8) (***P<0.001). (H) RT-qPCR analysis of the mRNA levels of UCP1 and other BAT genes in the RCC and control groups (**P<0.01) (n=104). (I and J) RT-qPCR analysis of the mRNA levels of white adipocyte and brown adipocyte genes in the PAT of the RCC and control groups (n=104) (*P<0.05, ***P<0.001). (K-M) RT-qPCR analysis of the mRNA levels of adipocyte metabolism-related genes and mitochondrial function genes in the PAT of the RCC and control groups (n=104). PAT, perirenal adipose tissue; RCC, renal cell carcinoma; RT-qPCR, reverse transcription-quantitative PCR; UCP1, uncoupling protein 1.


