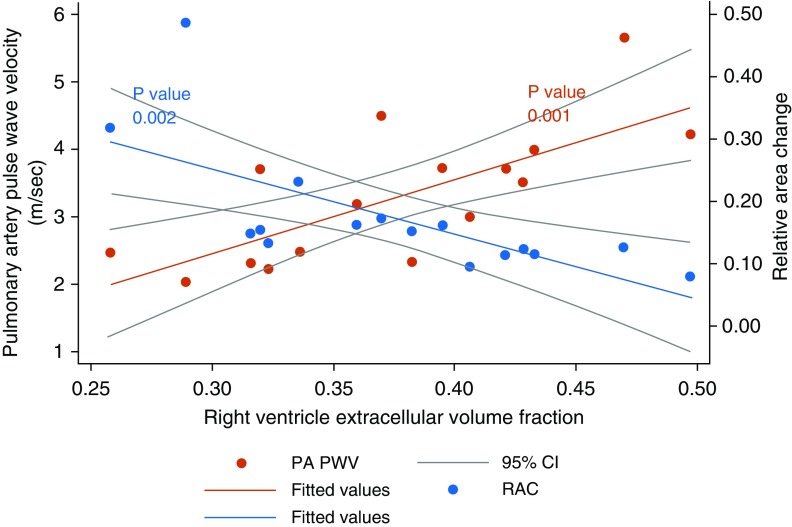
Figure 1.
Scatterplots with fitted lines and 95% confidence intervals (CIs) demonstrating a linear relationship between the pulmonary artery pulse wave velocity (PA PWV) and right ventricle extracellular volume fraction, and an inverse linear relationship between the pulmonary artery relative area change (RAC) and right ventricle extracellular volume fraction.

