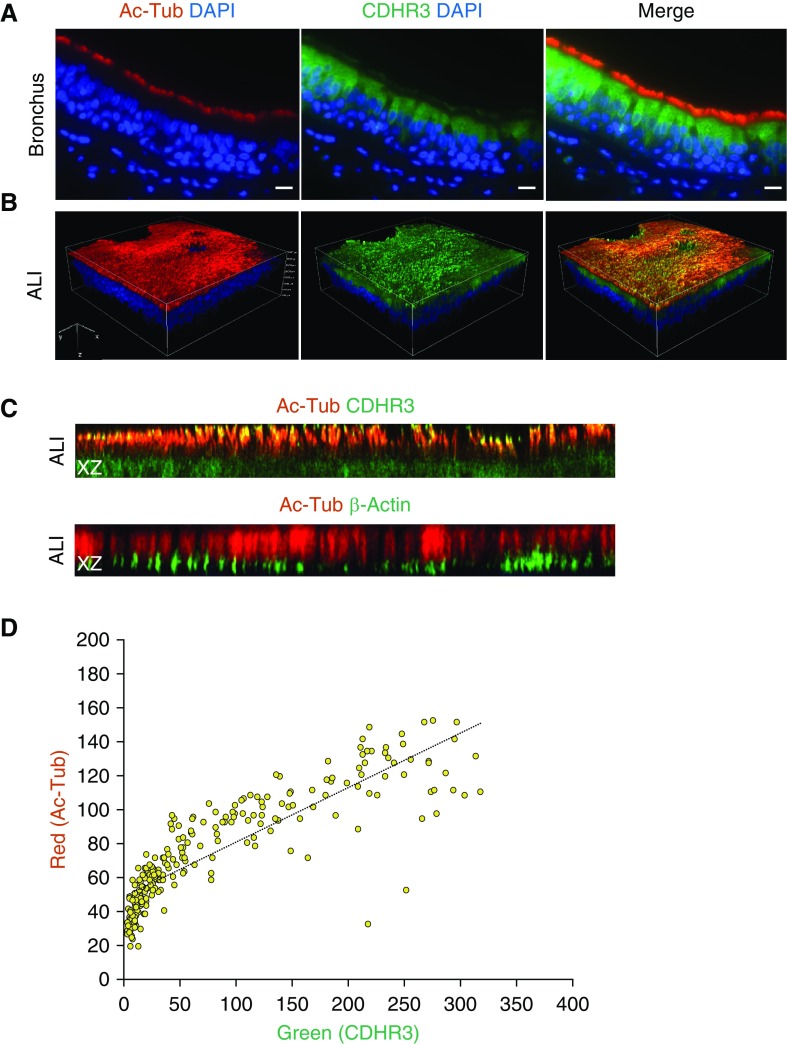
Figure 2.
CDHR3 expression in cilia of bronchial epithelial cells. (A) Immunofluorescent staining profiles of acetylated α-tubulin (Ac-Tub; red), CDHR3 (green), and nucleus (DAPI) in the epithelium of human bronchial tissue. (B) Three-dimensional volume view of Z-stack confocal images of immunofluorescent Ac-Tub (red), CDHR3 (green), nucleus (DAPI), and merged signals. Regions of red and green signal overlap are shown in yellow. (C) Z-stack confocal XZ slice view comparison of two separate cultures stained for (top) Ac-Tub (red) with CDHR3 (green) and (bottom) Ac-Tub (red) with β-actin (green). Regions of signal overlap are shown in yellow. (D) Scatterplot quantification of colocalization correlation (Pearson’s correlation = 0.72; Mander’s overlap = 0.88) of Ac-Tub and CDHR3 signals in the cilia region of XZ slice image in C. Scale bars: 10 μm.

