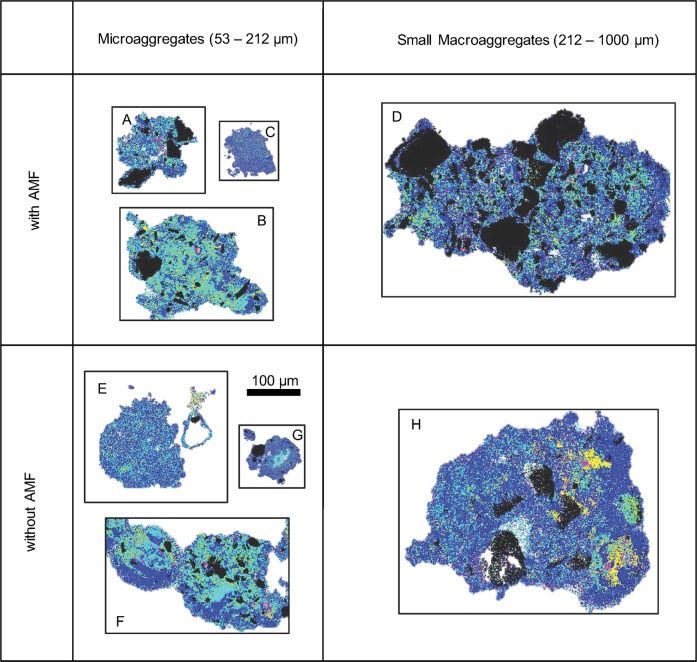
Fig. 2.
X-ray fluorescence data for a sample of aggregates. Images show locations of five elements in each aggregate thin section. Each pixel, the finest unit of resolution during microscopy, is drawn with only one color representing either a sand grain if present, or the most abundant REE in that pixel. Sand grains are seen as Si—black. At the start of the experiment large macroaggregates were labeled with Nd—yellow, small macroaggregates were labeled with Sm—blue, microaggregates were labeled with Gd—magenta, and primary particles were labeled with La—cyan

