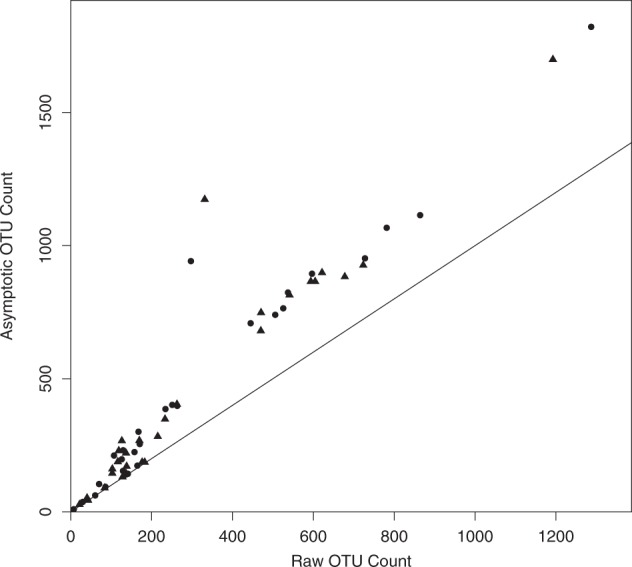
Fig. 2.

Comparison of observed and asymptotic OTU counts (species richness; q = 0) for healthy individuals (circles) and diseased individuals (triangles). The solid line has intercept 0 and slope 1, which would be found if the observed OTU count and the asymptotic estimator were the same. The asymptotic estimator is the observed OTU count plus the estimated number of undetected OTUs in the group. The asymptotic OTU count has a linear correlation with the raw OTU count (r = 0.98, p < 0.001)
