Fig. 4.
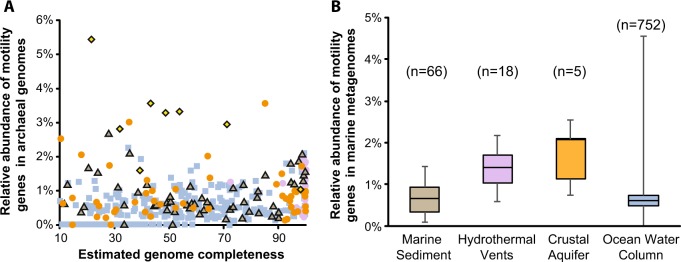
The relative abundance of motility genes in publicly available marine-related genomes and metagenomes as defined by COG (Clusters of Orthologous Groups) annotations. a Relative abundance of motility genes in single-amplified genomes and metagenome-assembled genomes collected from various marine environments relative to their genome completeness (considering genomes that are at least 10% complete, Table S28): sediments (brown triangle), hydrothermal vents (purple circle), crustal aquifers (orange circles), and ocean water column samples (blue squares). Candidatus Hydrothermarchaeota genomes are highlighted as yellow diamonds. b The relative abundance of motility genes in metagenomes collected from various marine environments (Table S29). The box and whiskers represent the range of relative abundance as defined by quartiles

