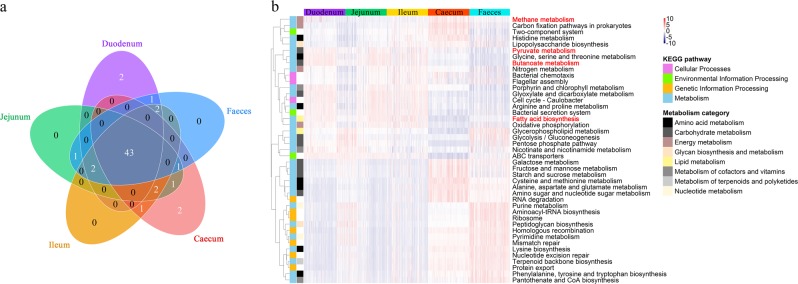
Fig. 2.
Comparison of the functional capacities of the gut microbial communities in diverse segments. a Overlap of the top 50 predictions among the five gut sections. b Heatmap showing the 43 shared predictions with different abundances among the diverse gut locations (see Supplementary Table S4). The heatmap is colour-coded based on row z-scores

