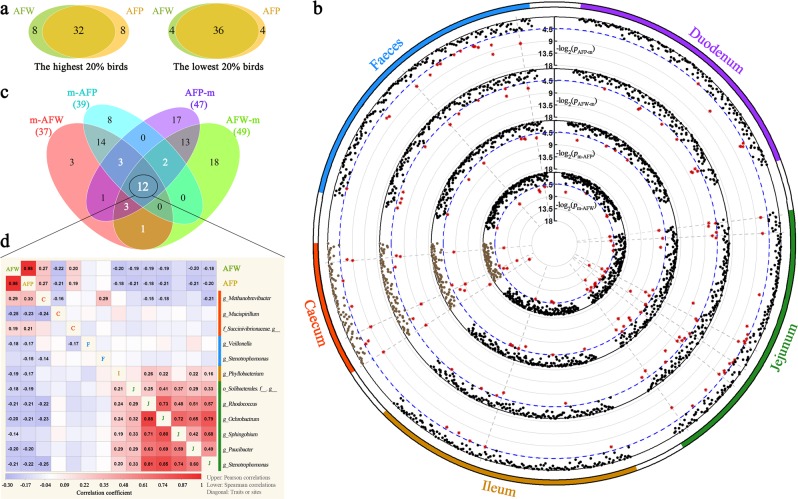
Fig. 5.
Adiposity-associated microorganisms. a Overlap analysis of the shared individuals in both the abdominal fat weight (AFW) and abdominal fat percentage (AFP) ranked groups of the highest 20% (N = 40) and lowest 20% (N = 40), respectively. b Significant p-values for each Wilcoxon rank-sum test (see methods). Displayed from the outer to the inner circle are the gut segment, the significance test in each microbial abundance between the highest- and lowest-AFP birds (pAFP–m), the significance test in each microbial abundance between the highest- and lowest-AFW birds (pAFW–m), the significance test in AFP between the two groups with the highest and lowest microbial abundance (pm–AFP), and the significance test in AFW between the two groups with the highest and lowest microbial abundance (pm–AFW), where p-values are plotted as −log2 (p-value); the blue dashed line shows the significance threshold (p < 0.05). Each point represents a microorganism and the red point indicates the p-value passed the significance threshold. The grey dashed line indicates that the pAFW–m, pm–AFW, pAFP–m and pm–AFP values for one microorganism are all < 0.05. c The number of microbial genera associated with AFP and AFW at p < 0.05 and their overlaps with each other. The 12 shared microbial genera are considered potentially related to fat deposition. d Pearson’s (upper diagonal) and Spearman’s (lower diagonal) correlations among the AFW, AFP and the shared 12 microbial genera. Red and blue tiles indicate positive and negative correlations, respectively; significant R-values are filled in numerically (p < 0.05). The diagonal shows the fatness traits or gut segments (C caecum, F faeces, I ileum, J jejunum)

