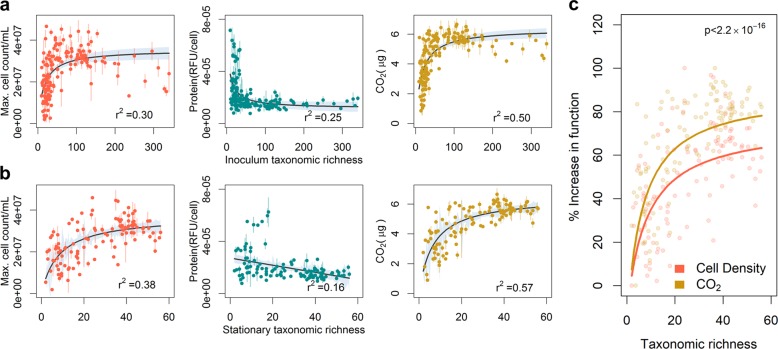
Fig. 2.
Diversity strongly impacts all measures of community function. Relationship of different measurements of community production (cell numbers and protein per cell) and respiration (CO2 production) with a inoculum taxonomic richness and b stationary phase taxonomic richness of communities. c Comparison of the hyperbolic fits for CO2 production and cell density scaled to 1 as maximum. Each dot represents one inoculum community; colored bars indicate the standard deviation of the measurement; black/colored lines indicate fits to an appropriate model selected between a linear, log-linear, and hyperbolic least squares fit with blue-gray regions around the line indicating the 95% confidence of the fit

