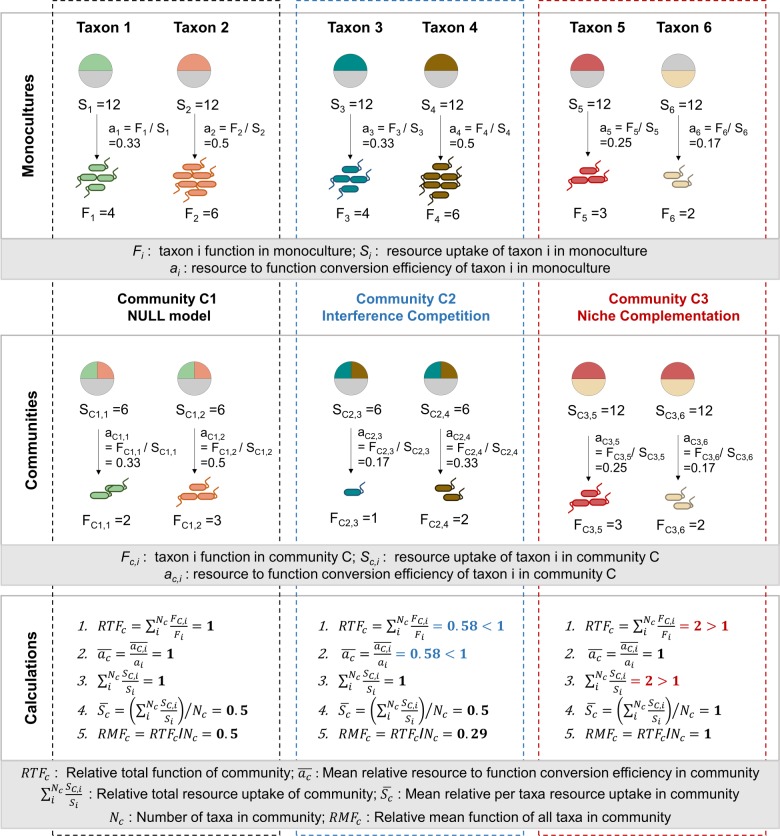
Fig. 3.
Graphical illustration of the RTFC concept. The RTFC allows determination of interaction effects on community function by summing the relative function of each taxon in the community compared to its monoculture. Functions suitable for this analysis are thus limited to those that can be summed across taxa, such as biomass or CO2 production. For illustration purposes, the function of interest used in this graph is the number of microbes. Community C1 represents a case of the null model (): taxa 1 and 2 are capable of utilizing the same resources when separately in monoculture (colored regions in circles; circles represent total resources available). When together in a community, the two taxa equally split the pool of resources that they are both capable of utilizing (relative total resource uptake , mean relative per taxa resource uptake ). However, the resource to function conversion efficiency of each taxon is not affected by the other (mean relative resource to function conversion efficiency ). As a result, the output function (number of cells) is proportional to the resource allocation between the two taxa. In Community C2 (), the two taxa 3 and 4 interfere with each other when sharing resources in a community, resulting in a mean relative resource to function conversion efficiency . Here, although resource uptake is exactly the same as in the null model, the output function is reduced. In Community C3 (), the two taxa 5 and 6 perfectly complement each other in resource use (relative total resource uptake , mean relative per taxa resource uptake ), and do not affect each other’s resource conversion efficiencies . See also Fig. S4 for an extension case where complementation and competition cancel out to result in an RTFC of 1 but should be distinguished from the null model

