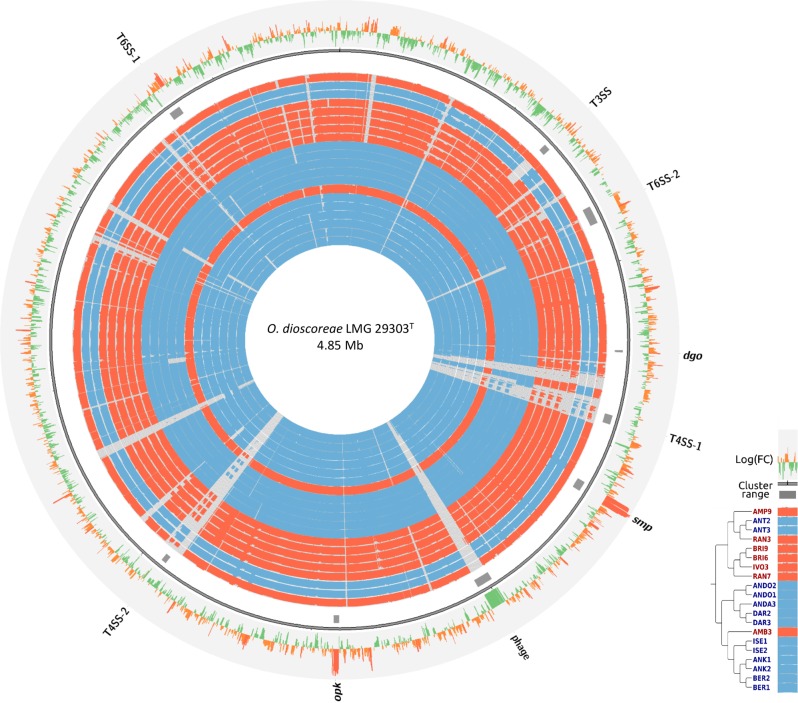
Fig. 3.
Conservation and expression of O. dioscoreae genes. Inner circles represent nucleotide conservation (% Blastn identity) of that genome with the type strain LMG29303T as histograms. A legend showing the order of the genomes used for comparison is shown at the bottom right. Blue and red rings correspond to samples collected in the Diana and Atsinanana regions, respectively. Outer rings show the log2 fold change of predicted genes in the leaf nodule compared to in culture as measured by RNA-Seq. Loci discussed in the text are indicated with gray rectangles

