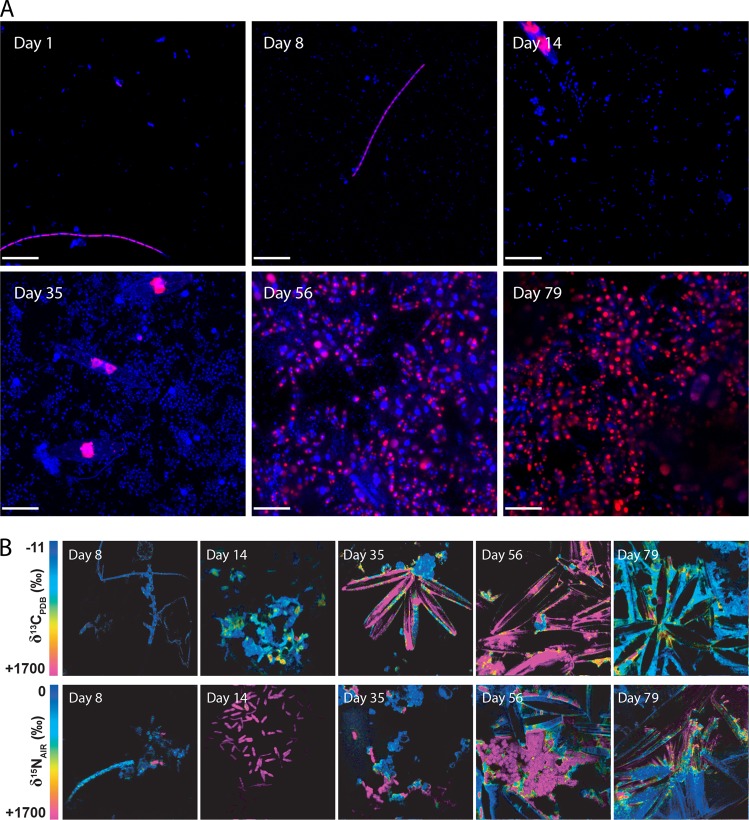
Fig. 2.
The community changed morphology frequency of autotorphic and diazotrophic cells as members were recruited during succession. a Confocal micrographs showing changes in biofilm community morphology as visualized by the DNA stain (Hoechst; blue) and chlorophyll autofluorescence (red); scale bars represent 20 µm. b Magnitude and distribution of 13C and 15N incorporation in representative biofilm communities showing incorporation of labelled substrates over different incubation periods. Top row: δ13C distribution after incubation with 13C-labelled bicarbonate. Bottom row: δ15N distribution after incubation with 15N-labelled N2. The full suite of replicate nanoSIMS images are presented in a supplementary file

