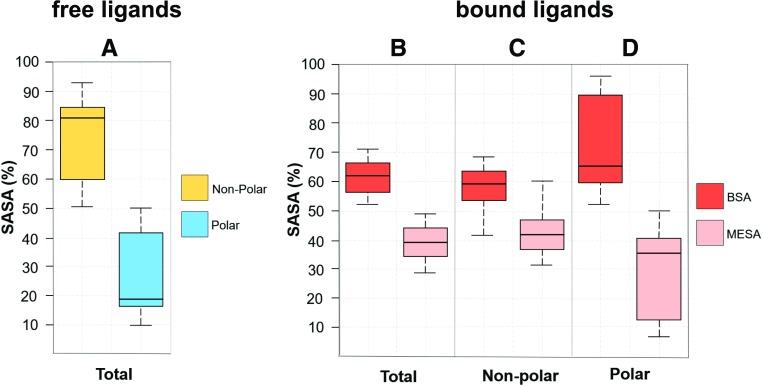
Fig. 5.
Box and whisker plots of solvent-accessible surface area (in percent) characteristics of the allosteric GPCR ligands (discussed in Table 1) in free (A) and receptor-bound states (B–D). The majority of the ligands are highly lipophilic with larger nonpolar SASA (A). In their receptor-bound states, significant (approx. 40%) portions of their total SASA (B) remain exposed to membrane lipids, denoted as membrane-exposed surface area, whereas ≥60% of their total SASA are buried within the receptor binding sites, denoted as buried surface area (BSA). Nonpolar SASA (C) of these ligands have BSA and MESA distributions very similar to those of their total SASA. However, the polar SASAs are mostly buried into the receptor sites (D). Lines inside the boxes denote medians, lower and upper ends of the boxes denote 25th and 75th percentiles respectively, and whiskers denote the lowest and highest observations.

