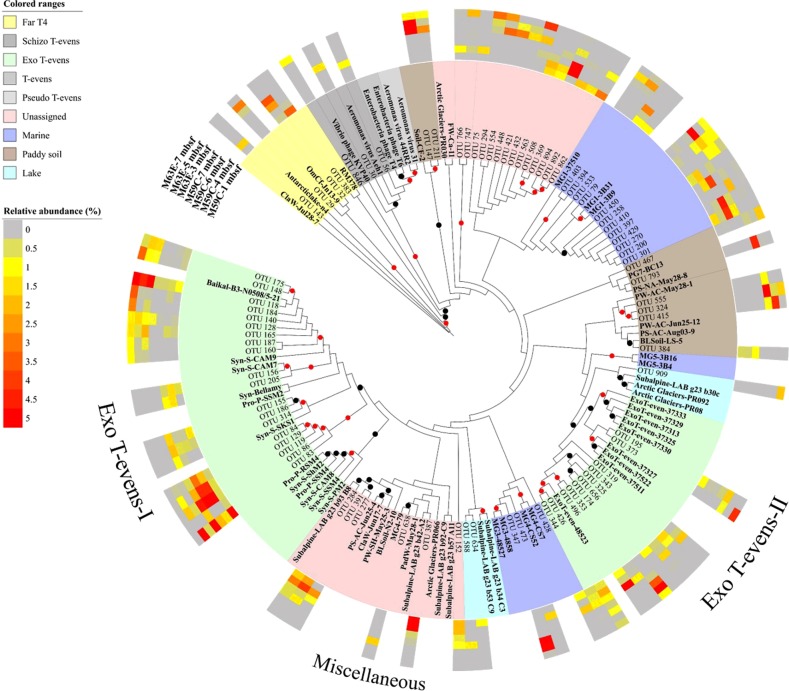
Fig. 4.
Maximum-likelihood phylogenetic analysis based on major g23 OTUs of amino acid sequences. OTUs with relative abundances >1% in each sample (a total of 84 OTUs) from Holes M59C and M63E of the Baltic Sea sediment were selected. Different colored ranges indicate g23 sequences from different groups or origins. Reference sequences are in bold text. Black and red dots show internal nodes with a >50% and >80% bootstrap (1000-fold replicated) support, respectively. The outer colored rings indicate the relative abundance of sequences of each OTU in each sample. Light gray indicates sequences undetected in the samples (relative abundance of 0%)

