Fig. 2.
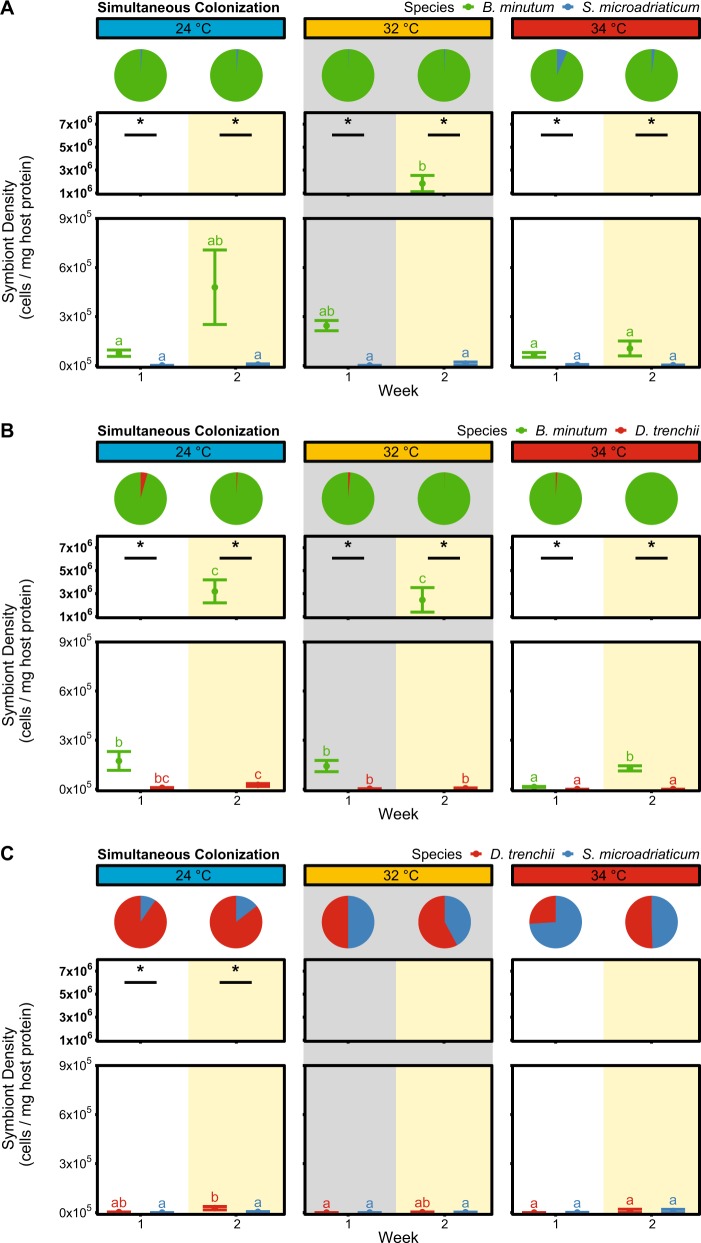
Simultaneous colonization experiments. Simultaneous mixtures of two different Symbiodiniaceae species (a 50% B. minutum and 50% S. microadriaticum; b 50% B. minutum and 50% D. trenchii; and c 50% S. microadriaticum and 50% D. trenchii) were introduced to aposymbiotic anemones (n = 4 polyps per treatment per time point). Symbiont densities (cells per mg host protein) were measured one and two weeks after inoculation under cool (24 °C), ambient (32 °C), and thermal stress conditions (34 °C) via genus-specific qPCR. Pie charts represent the average proportion of each species in the host’s total symbiont community. Error bars represent the standard error of the mean. Letters correspond to distinct cell densities within a species across treatments (color coded; two-way ANOVA; p < 0.05). Asterisks correspond to distinct cell densities across species within a treatment (one-way ANOVA; p < 0.05). To visualize large cell density changes without obscuring small changes, results were depicted across two plots each: note the y-axis break and unique scales

