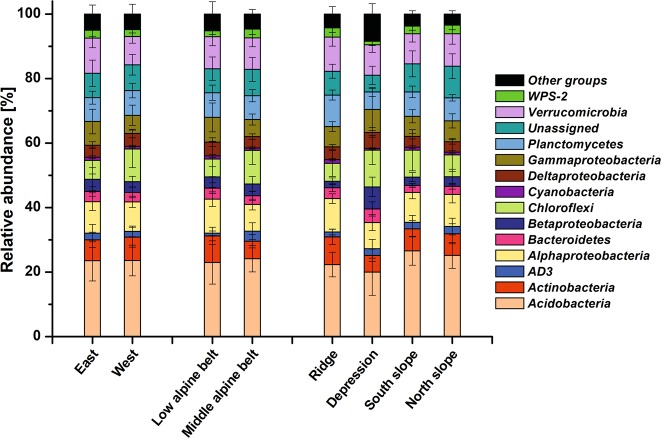
Fig. 3.
Stacked bar charts presenting the relative abundance of the predominant phyla and proteobacterial classes in samples grouped by eastern and western region, elevation according to alpine belt or micro-topography. Illustrated are differences in mean relative abundance and the corresponding standard deviation

