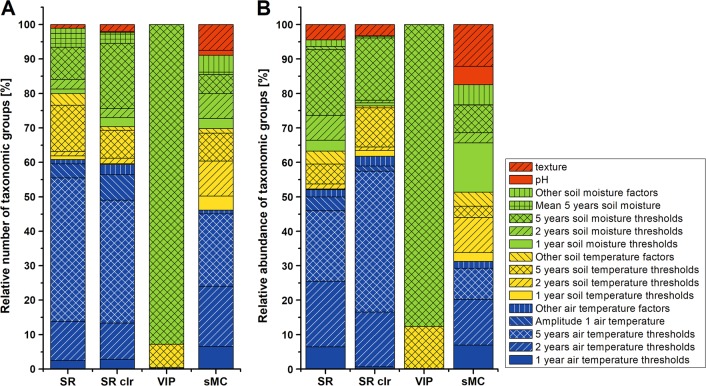
Fig. 4.
Most important environmental drivers as obtained by partial least-square regression (PLSR) for each individual taxonomic group (TG). Relative numbers in the respective categories were obtained by counting the number of TGs falling into each category (a) or considering the mean relative abundance of each TG across all samples (b). Different algorithms were used to identify the most important environmental driver for each TG: selectivity ratio (SR), variable importance in projection (VIP), and Significance Multivariate Correlation (sMC). In addition, PLSR was conducted based on a centered logratio (clr) transformed OTU dataset in combination with SR for variable selection (SR clr). Specific temperature and moisture threshold values were calculated as sum of hours for which a specific temperature and moisture threshold was exceeded over 1, 2, or 5 years

