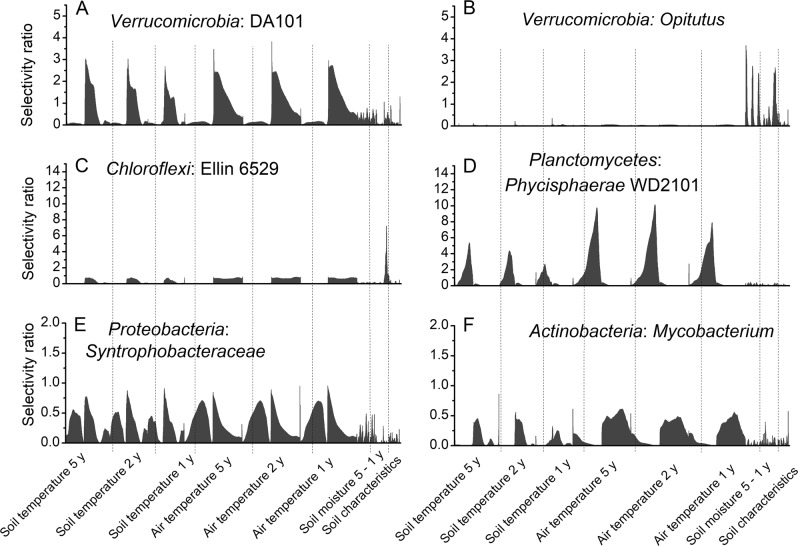
Fig. 5.
Examples of ecological response graphs showing the ecological response patterns of different taxonomic groups: a genus DA101, b genus Opitutus, c class Ellin 6529, d order Phycisphaerae WD2101, e family Synthrophobacteraceae, and f genus Mycobacterium. Plots display the selectivity ratios (SRs) of all environmental variables (Table S1). The first three sections, separated by dotted lines, represent soil temperature measures over 1, 2, and 5 years, respectively. Within each temperature section, stepwise increasing threshold values ranging from −16.9 °C to +22.4 °C are shown, followed by single values for amplitude, maximum, minimum, and mean. The same pattern is applied to present air temperature in a range from −25 °C to +25 °C and soil moisture ranging from 0 to 0.5 m3 H2O m−3 soil. The last section named soil characteristics includes soil texture, C, N, C:N ratio, and pH values

