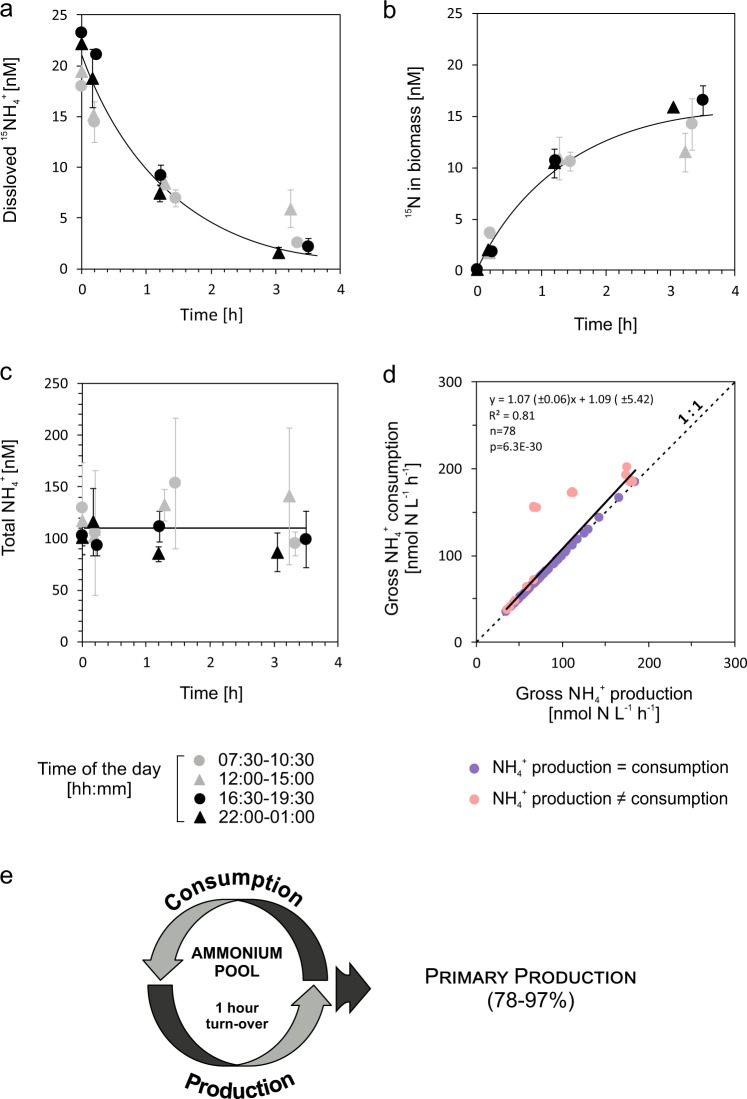
Fig. 4.
Ammonium dynamics in surface waters during N-depletion. Added 15N-ammonium decreased exponentially with time (a) and was mostly recovered in the biomass filtered onto GF/F filters (b), while total ammonium concentrations (measured after 15N-ammonium was added) remained at steady-state (c). Data are given as mean ± s.d. (n = 3) and are shown for incubations from June 2012 (a–c). Gross ammonium production and consumption rates (measured in June 2012 and August 2013) were positively correlated, following a close to 1:1 ratio (dashed line) (d). The rapid ammonium turn-over due to ammonium regeneration within 1 h could substantially sustain the N-demand for primary production (e)

