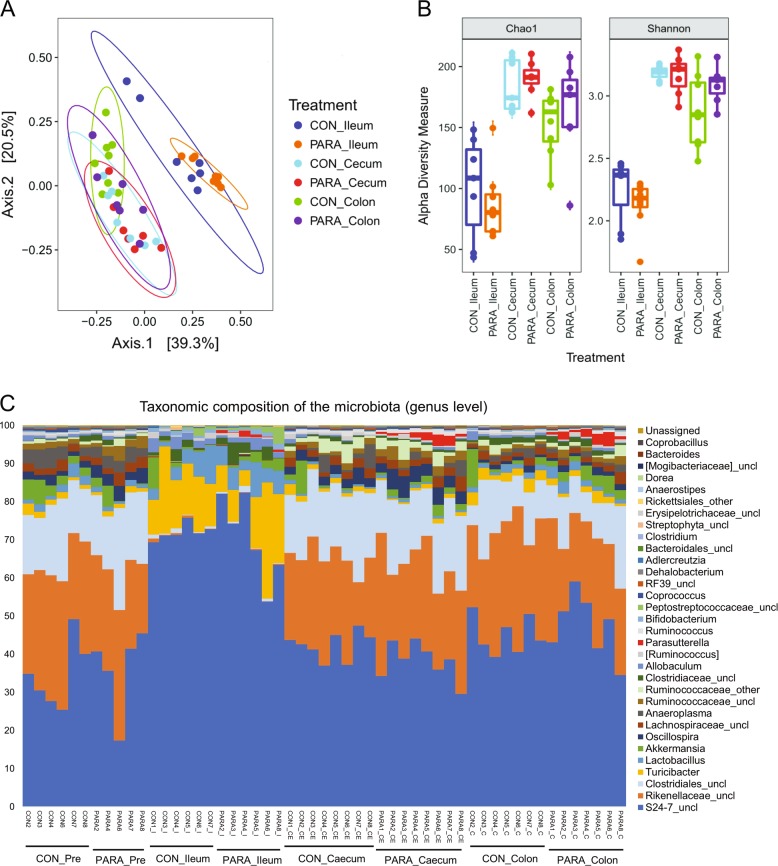
Fig. 3.
Microbial structural analysis of contents collected from different intestinal segments. a Principal coordinates analysis (PCoA) plots of the bacterial communities based on the Bray–Curtis dissimilarity metric. Colors represent intestinal sites and within the same intestinal site, each point represents an individual mouse. For all treatment groups, n = 8. b Alpha-diversity analysis of bacterial communities in ileal, cecal, and colonic contents of mice. All the contents were harvested 6 weeks after Parasutterella/PBS administration. Data are shown as mean ± s.e.m. c Bar chart indicating microbial community profiles between groups, summarized down to the genus level. Microbial composition of the two groups before experimental treatment are labeled as CON_PRE and PARA_PRE (color figure online)

