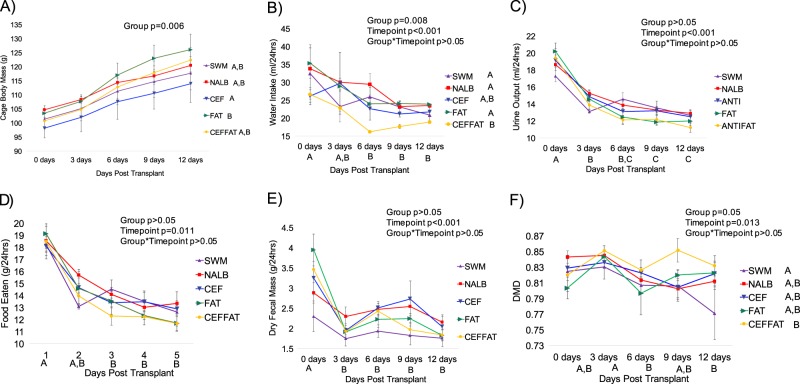
Fig. 2.
Effect of treatments on host response. Each timepoint represents the average daily value for the 3-day interval. a Body mass; b Water intake; c Urine output; d Food eaten; e Fecal output; and f DMD. Letters indicate statistically significant differences either by Treatment group (in legend) or by time point (on x-axis) as determined by a repeated measures ANOVA and post-hoc Tukey’s honestly significant difference analysis. Group, timepoint, and interaction ANOVA p-values are presented in the chart. No letters indicate no significant differences or not applicable. For body mass, the slope of body mass change was compared statistically with an ANOVA and therefore differences by timepoint are not applicable

