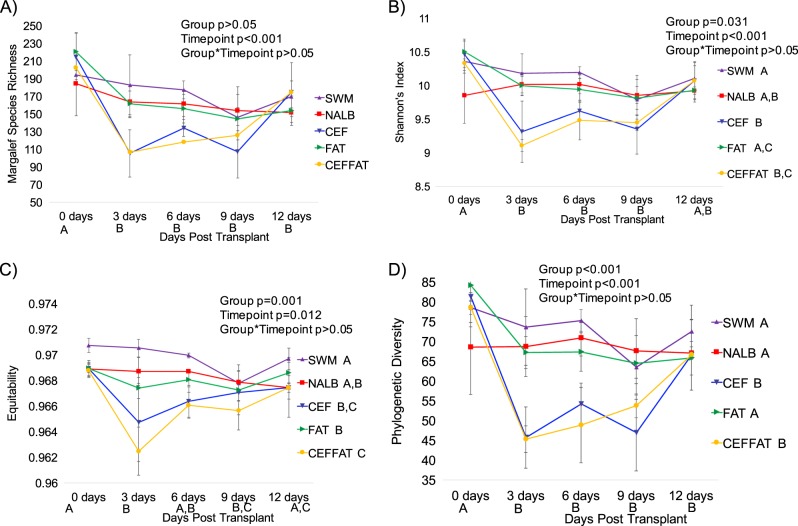
Fig. 4.
Alpha-diversity by group-time. a Margalef’s species richness; b Shannon’s index; c Equitability; d Phylogenetic diversity. Letters indicate statistically significant differences either by Treatment group (in legend) or by time point (on x-axis) as determined by a repeated measures ANOVA and post-hoc Tukey’s honestly significant difference analysis. No letters indicate no significant differences. Group, timepoint, and interaction ANOVA p-values are presented in the chart

