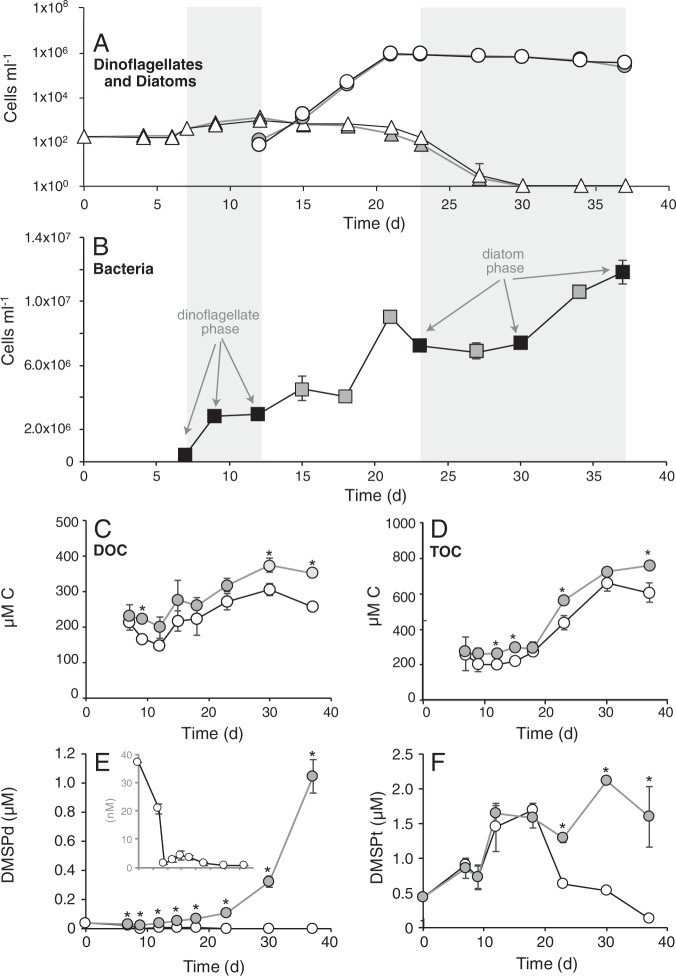
Fig. 1.
Cell abundance and chemical data from the model system. a Dinoflagellate (triangles) and diatom (circles) cell abundances in co-cultures (white symbols) and axenic cultures (gray symbols). b Bacteria cell numbers in co-cultures, with time points of transcriptional analysis indicated by black symbols. c–f Concentration of dissolved organic carbon (DOC), total organic carbon (TOC), dissolved dimethylsulfoniopropionate (DMSP) (DMSPd), and total DMSP (DMSPt) in co-cultures (white symbols) and axenic cultures (gray symbols). The inset in e shows DMSPd concentrations in the co-culture treatment at a resolved scale. n = 3 for all measurements. Standard deviations falling within the height of the symbol are not shown. Asterisks indicate significant differences (p < 0.05)

