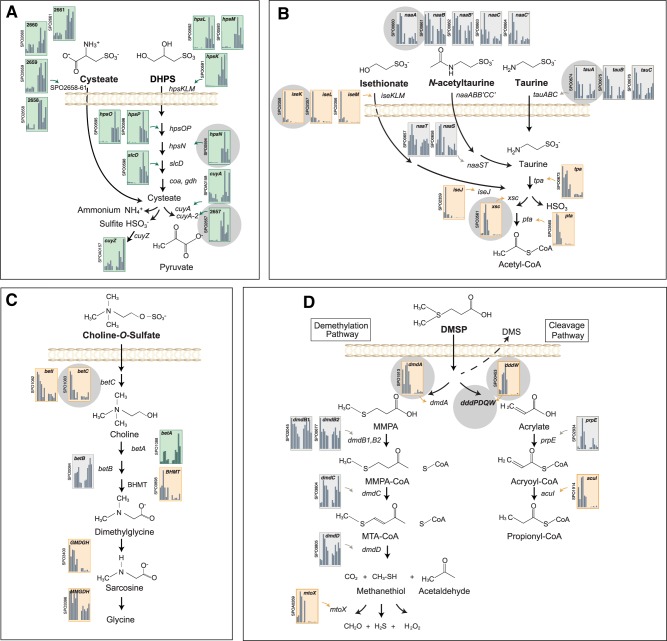
Fig. 2.
Expression of organic sulfur pathways by R. pomeroyi. Histograms indicate relative expression (TPM) for genes encoding transformation of a C3 sulfonates, b C2 sulfonates, c a sulfate ester, and d a sulfonium compound. The first six bars in each represent expression during the dinoflagellate phase (sampling days 7, 9, and 12) and the last six bars represent expression during the diatom phase (sampling days 23, 30, and 37), with replicates (n = 2) shown separately. Orange backgrounds indicate genes with significant enrichment in the dinoflagellate phase and green indicate significant enrichment in the diatom phase (DESeq2, p < 0.05). Genes used in the Tara Oceans bioinformatic analysis are marked with gray circles

