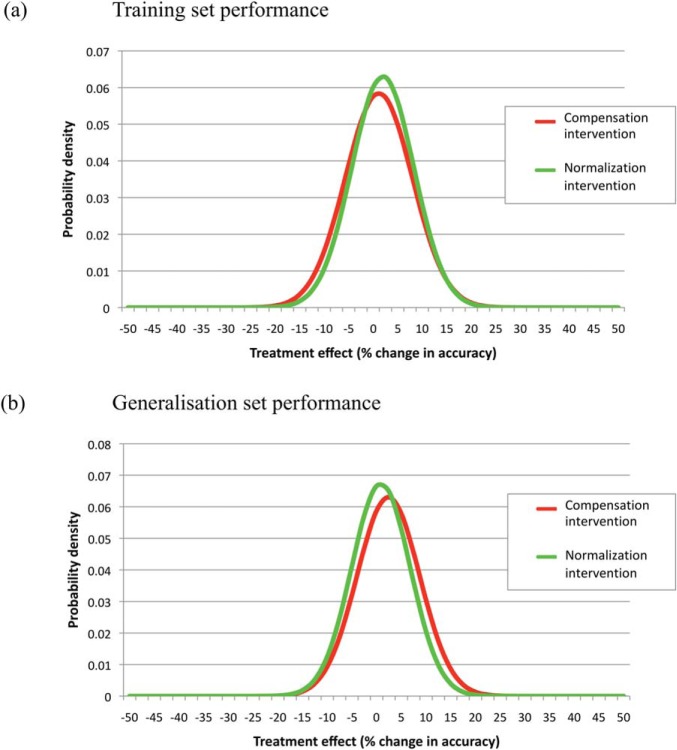
Figure 10.
Individual differences in response to intervention, following two types of intervention. Developmental deficits were caused by an overpruning disorder (Davis, 2017). The x axis shows treatment effect in terms of change in proportion correct. (a) Distribution for performance on the training set following the normalization or compensation treatment; (b) distribution for performance on the generalization set following either normalization or compensation treatment. [Population of 1000 networks, intervention for duration of 40 epochs applied early in development, epoch 30 of a life span of 1000, performance tested at 100 epochs].

