
Figure 6.
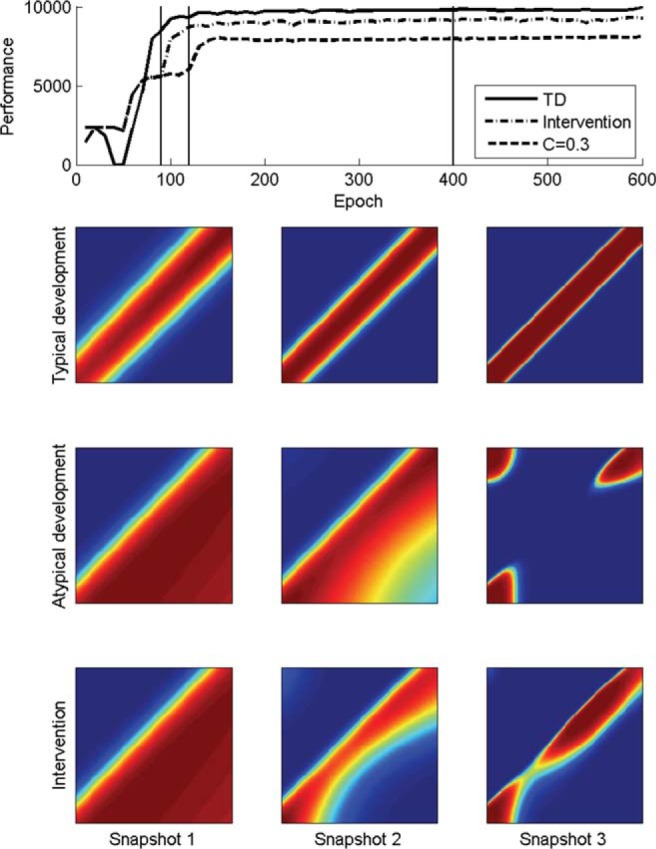
Developmental trajectories and internal representations in a typical case (TD), an atypical case with low connectivity (30%, C = 0.3) and the same atypical case experiencing an intervention. Top panel: Developmental trajectories; intervention commenced at 100 epochs. The intervention set was added to the training set for the duration of training. Vertical lines show epochs at which snapshots were taken. Lower panels: snapshots of the activation pattern of the unit for output category 2 in the three cases, which should respond only to the central band (see Figure 6). Hot colors represent more activity. (Fedor et al., 2013).