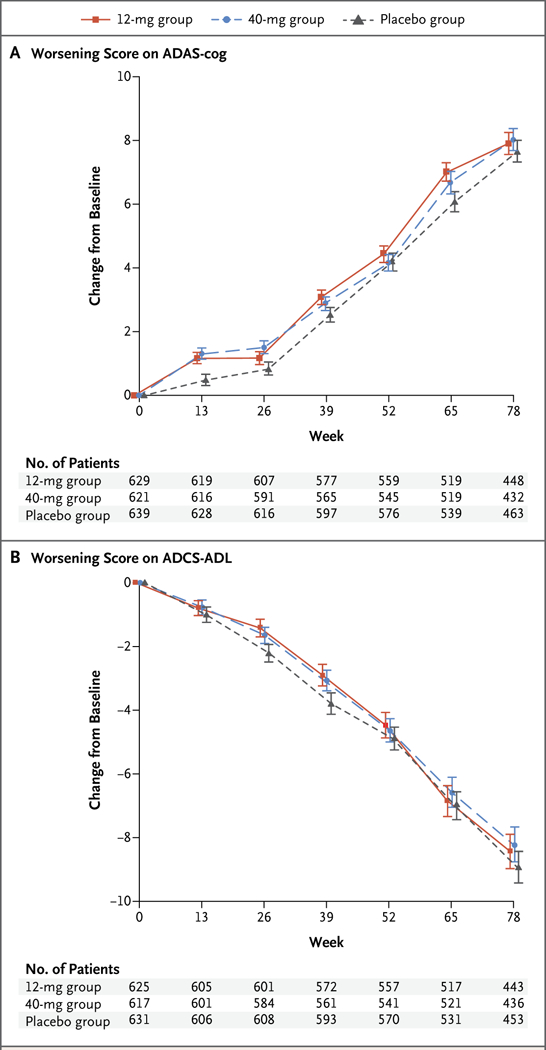
Figure 2. Mean Change from Baseline in the ADAS-cog and ADCS-ADL Scores over 78 Weeks (Part 1 of the Trial).

Panel A shows the mean change from baseline in the score on the cognitive subscale of the Alzheimer’s Disease Assessment Scale (ADAS-cog); scores range from 0 to 70, with higher scores indicating worse dementia. Panel B shows the mean change from baseline in the score on the Alzheimer’s Disease Cooperative Study Activities of Daily Living Inventory scale (ADCS-ADL); scores range from 0 to 78, with lower scores indicating worse function. I bars indicate standard errors.
