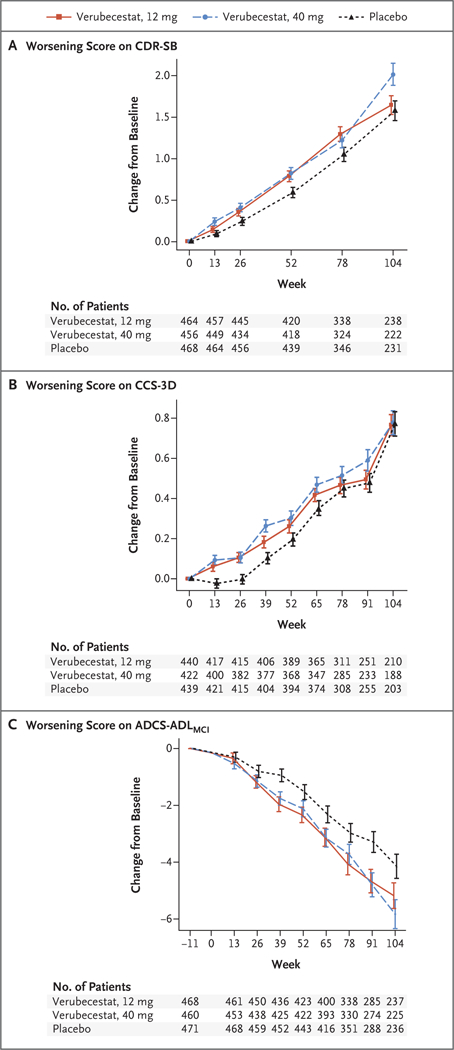
Figure 2. Mean Change from Baseline in the CDR-SB, CCS-3D, and ADCS-ADLMCI Scores over 104 Weeks.

Panel A shows the mean change from baseline in the score on the Clinical Dementia Rating Scale-Sum of Boxes (CDR-SB); scores range from 0 to 18, with higher scores indicating worse cognition and daily function. Panel B shows the mean change from baseline in the score on the three-domain composite cognition score (CCS-3D; derived from the z scores [mean of 0, standard deviation of 1, with higher scores indicating worse cognition] of tests of episodic memory, executive function, and attention and processing speed). Panel C shows the mean change from baseline in the score on the Alzheimer’s Disease Cooperative Study Activities of Daily Living for Mild Cognitive Impairment Inventory scale (ADCS-ADLMCI); scores range from 0 to 53, with lower scores indicating worse function. Baseline is plotted at week −11, which is the mean assessment time of the baseline measurement as offset from the first dose of trial agent at week 0. As a result, there are no data plotted at week 0. The time course of the verubecestat groups between week −11 and week 0 was assumed to follow the same course as the placebo group. From this week 0 placebo coordinate, the time course for each respective verubecestat group was extended to the estimate at the first scheduled postdose time point. I bars indicate standard errors.
