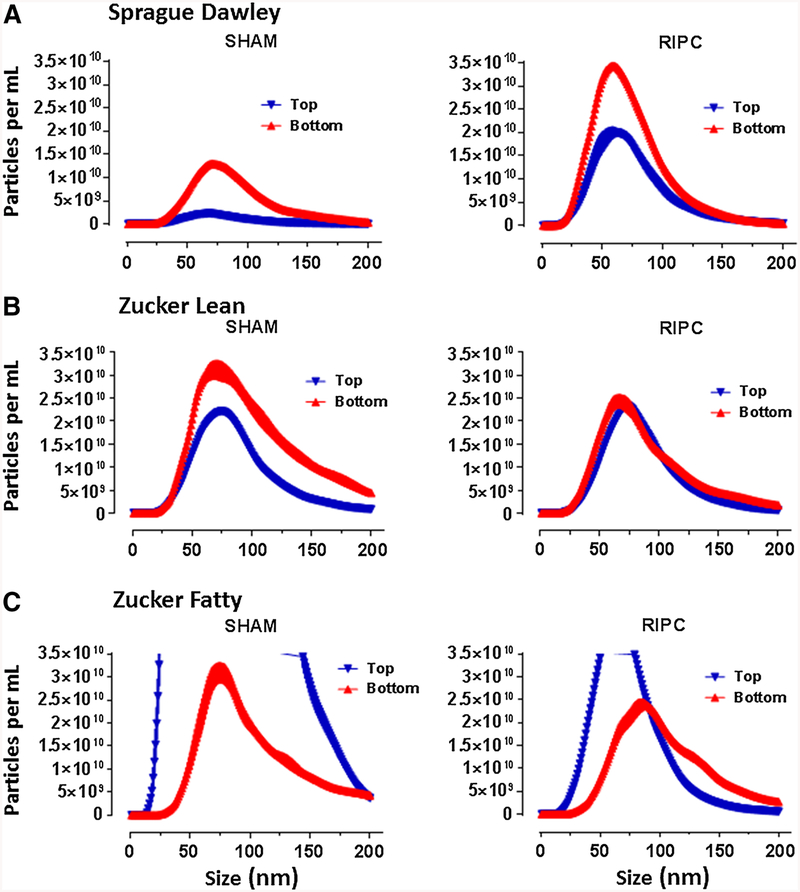
Fig. 5.
a Protocol 4A: frequency distribution of nanoparticle concentration (number/mL) in serum fractions (supernatant-bottom, supernatant top) obtained from Sprague–Dawley rats following the standard RIPC stimulus or a time-matched sham-control period. Data are plotted as mean values ± SEM (3 replicates per sample), at 1-nm increments, for particles ranging from 0 to 200 nm. b Protocol 4A: frequency distribution of nanoparticle concentration (number/mL) in serum fractions (supernatant-bottom, supernatant top) obtained from Zucker lean rats following the standard RIPC stimulus or a time-matched sham-control period. Data are plotted as mean values ± SEM (3 replicates per sample), at 1-nm increments, for particles ranging from 0 to 200 nm. c Protocol 4A: frequency distribution of nanoparticle concentration (number/mL) in serum fractions (supernatant-bottom, supernatant top) obtained from Zucker fatty rats following the standard RIPC stimulus or a time-matched sham-control period. Data are plotted as mean values ± SEM (3 replicates per sample), at 1-nm increments, for particles ranging from 1 to 200 nm. Peaks of the frequency distributions for the supernatant-top fractions exceed the range of the common y-axis used for all panels: i.e., mode of 62 nm with a mean concentration of 7.6 × 10¹¹ particles/mL and mode of 65 nm with a mean concentration of 4.5 × 10¹⁰ particles/mL for sham-control and RIPC-treated rats, respectively

