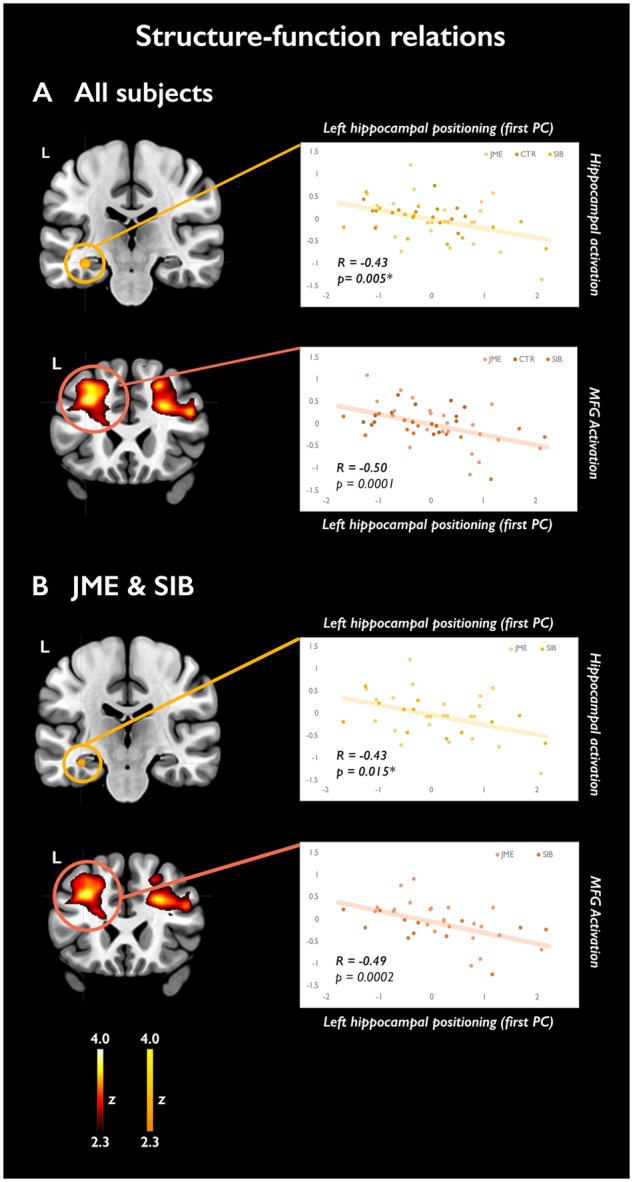
Figure 6.

Structure-function relations. The scatterplots highlight the association between the composite morphological indicator of left hippocampal positioning and activation of the left hippocampus (orange-yellow scale) and middle frontal gyrus (‘hot’ colour scale) for successfully encoded verbal items. (A) Analysis of all study subjects. (B) Analysis of a subgroup composed of patients with JME and their siblings. Local activation maxima, corresponding to the area of maximal correlation between structural and functional metrics, are shown on coronal sections. Maps for mesiotemporal effects show voxels included in the 12-mm diameter sphere centred on the local maximum, where peak-level significance at P < 0.05-FWE corresponds to a z-score >2.3. Extra-mesiotemporal activations are displayed at an uncorrected threshold (P < 0.01, cluster extent threshold of 10 voxel), corresponding to z scores >2.3. Colour-bars reflect z-score scales for mesiotemporal and extra-mesiotemporal activations. The P-values reported on the scatterplots for hippocampal effects are small-volume corrected for multiple comparisons (asterisk); the P-values for middle frontal effects are uncorrected for multiple comparisons. MNI coordinates are provided in Supplementary Table 6.
