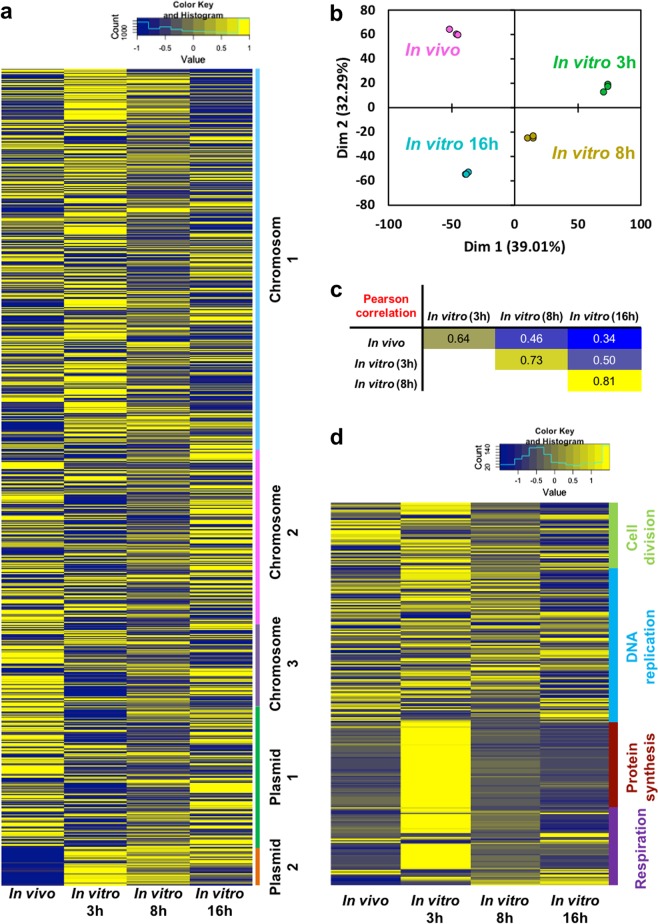
Fig. 3.
Gene expression profiles of in vivo and in vitro Burkholderia symbiont. a heatmap of 5872 gene expression profiles, b Principal component analysis, and c the pairwise Pearson correlation coefficients of in vivo and 3 h-, 8 h-, and 16 h-cultured in vitro cells. In the heatmap, the normalized mean expression level of the three biological replicates was used, and the color scale from blue to yellow indicates the relative expression level. d Gene expression profile of core cellular functions. The heatmap shows the expressions of 281 genes encoding cell division, DNA replication, protein synthesis, and respiration in in vivo and in vitro symbiont cells

