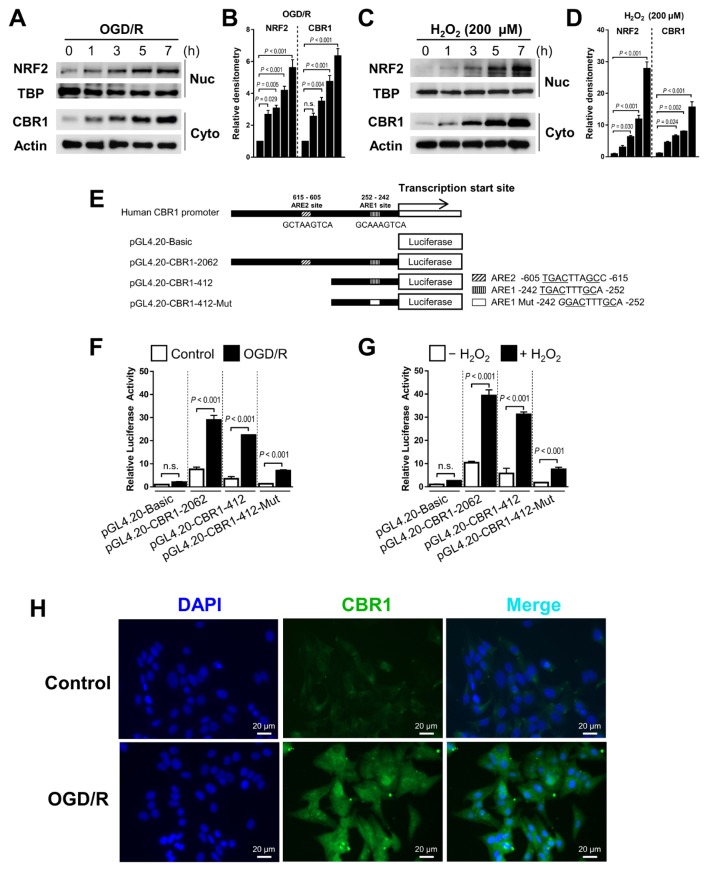
Fig. 1. Temporal regulation of CBR1 expression by Nrf2 with OGD/R and hydrogen peroxide.
(A–D) CBR1 is upregulated temporally by Nrf2 during OGD/R and hydrogen peroxide treatment. Western blot images and densitometric quantitation of the blots. (E) Schematic diagram of the promoter regions of human CBR1, including full-length ARE1 and ARE2 and an ARE1 mutant. (F and G) Luciferase reporter assay with OGD/R and hydrogen peroxide treatment. (H) CBR1 immunofluorescent staining. Normal hepatic hepaRG cells were stained with anti-CBR1 monoclonal antibody. Blue, DAPI; Green, human CBR1. Data are representative of five independent experiments. Data are presented as the mean ± SD. Respective comparison was indicated by a line and P value. n.s., not significant.

