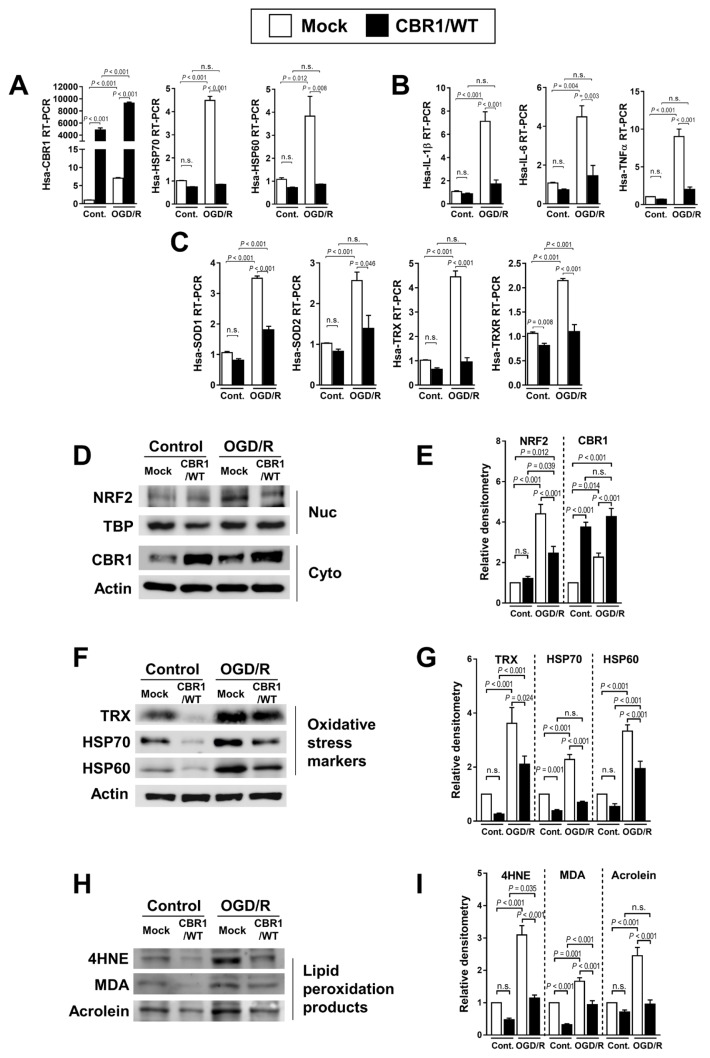
Fig. 5. Gain-of-function study of CBR1 in normal hepatocyte cells under hydrogen peroxide treatment.
(A) Transcription levels of CBR1 and oxidative stress markers (HSP70 and HSP60) in mock transfected cells and a CBR1-overexpressing stable cell line under OGD/R. (B) Fold change in inflammatory cytokines (IL-1β, IL-6, and TNFα) in mock control vs CBR1-overexpressing cells. (C) Expression of antioxidant enzymes (SOD1, SOD2, TRX, and TRXR) in CBR1-overexpressing cells under OGD/R. (D and E) Western blot analysis of Nrf2 and CBR1 with relative density. (F and G) Oxidative stress markers (TRX, HSP70, and HSP60) with relative density. (H and I) Lipid peroxidation products (4HNE, MDA, and Acrolein) with relative density. Protein levels were normalized to Actin, except for Nrf2 which was normalized to TBP. The levels of other compounds were normalized to matching control group. Cont., control; White bar, Mock-treated; Black bar, CBR1/WT. Comparison is indicated by a line and P value. n.s., not significant. n = 10 per group.

