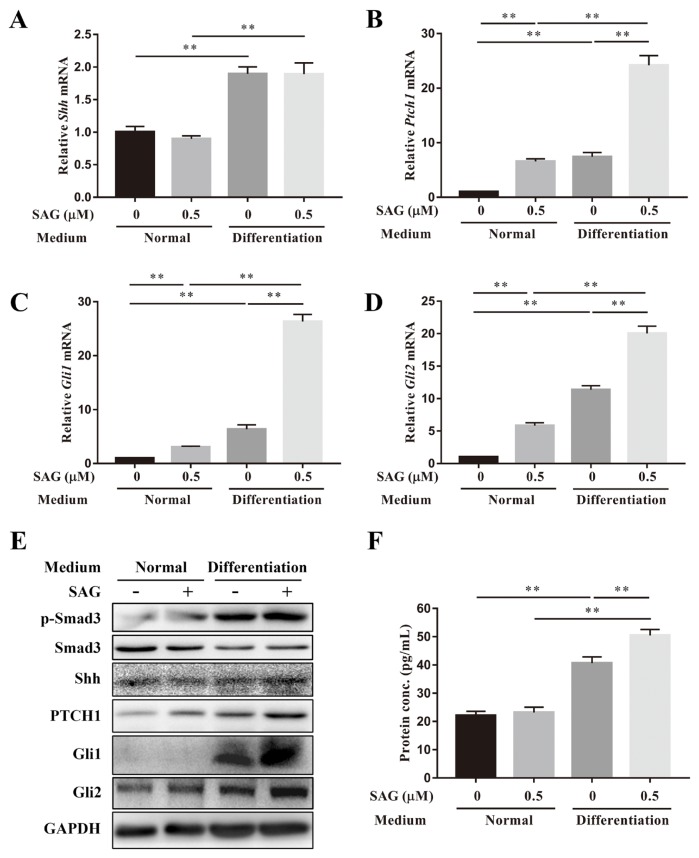
Fig. 3. The Shh signaling pathway was activated by SAG and TGF-β3.
Gene expression levels of (A) Shh, (B) Ptch1, (C) Gli1, and (D) Gli2 of ADSCs cultured in normal or differentiation medium with or without SAG were measured on day 14, and normalized to 18s. (E) The protein expression levels of p-Smad3, Smad3, Shh, PTCH1, Gli1, and Gli2 of ADSCs cultured in normal or differentiation medium with or without SAG on day 14 were measured. (F) The Shh protein secreted in medium during culture was quantified by ELISA. Data represent mean ± SEM. **P < 0.01.

