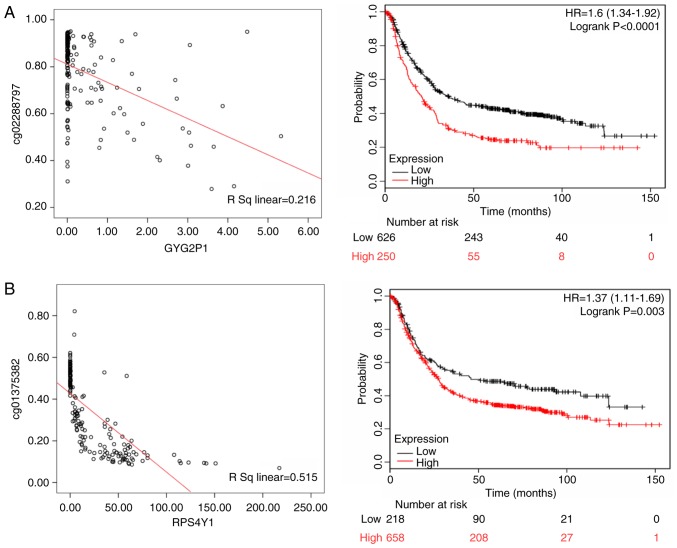
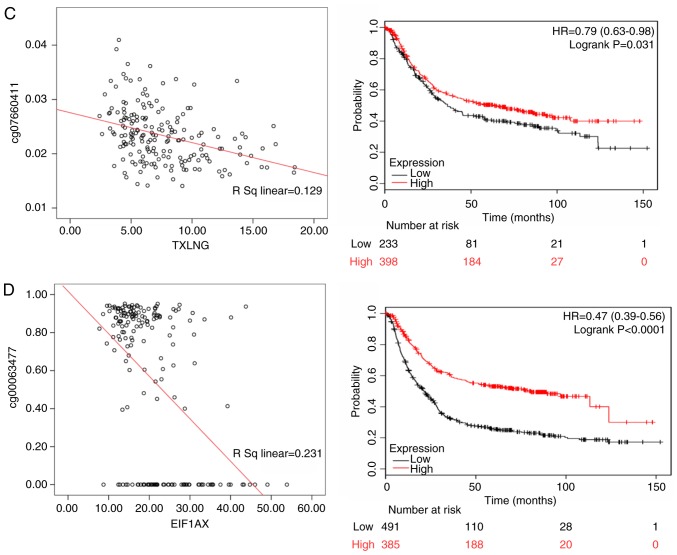
Figure 7.
The left panels shows the correlation between methylated sites and gene expression in White gastric cancer patients. The right panels represent the Kaplan-Meier OS of gene expression in White gastric cancer patients. (A) GYG2P1; (B) RPS4Y1; (C) TXLNG; and (D) EIF1AX. GYG2P1, glycogenin 2 pseudogene 1; RPS4Y1, ribosomal protein S4 Y-linked 1; TXLNG, taxilin-γ; EIF1AX, eukaryotic translation initiation factor 1A X linked.


